Spatial Transcriptomics with 10x Genomics Visium Platform

The Visium Spatial Gene Expression platform
Spatial transcriptomics preserves tissue architecture and links gene expression to the native positional context of cells, enabling researchers to uncover functional regions, microenvironments, and interactions that are invisible to dissociated single-cell methods. The 10x Genomics Visium Spatial Gene Expression platform maps gene activity across intact tissue sections while maintaining spatial context, revealing how cells organise, interact, and function within healthy and diseased tissues.
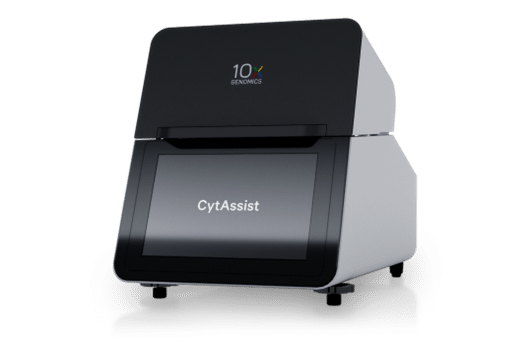
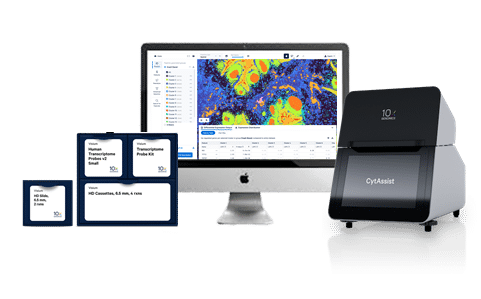
Visium CytAssist
The Visium CytAssist is a compact benchtop instrument that streamlines spatial profiling workflows and enables flexible sample management. It supports fresh tissue sections as well as pre-sectioned archival slides, including H&E- or immunofluorescence-stained FFPE samples. Researchers can pre-screen tissues using standard histology to select biologically relevant regions before spatial analysis. CytAssist automates precise probe transfer to capture slides in a controlled environment, ensuring accurate spatial barcode assignment and high-fidelity spatial gene expression data.
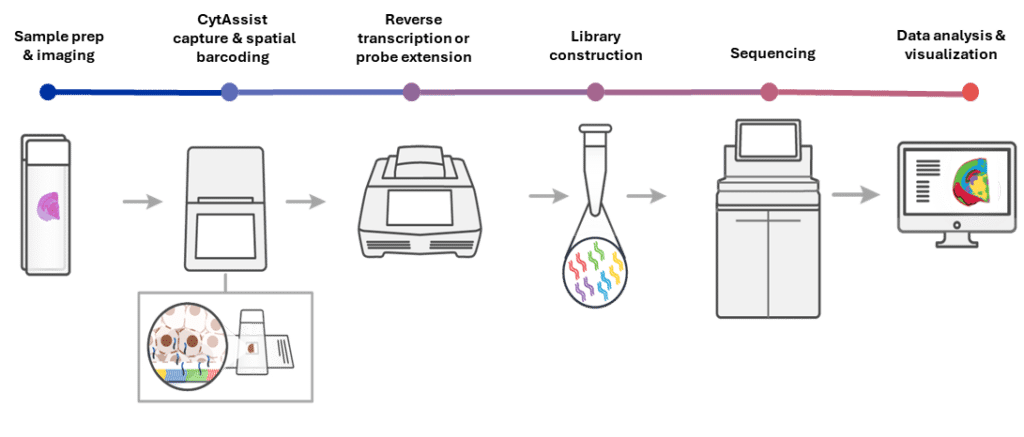
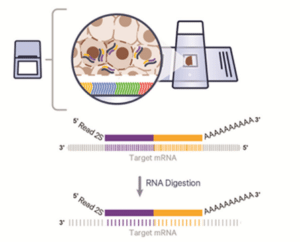
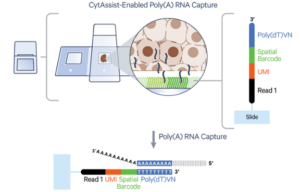
How the Visium Spatial workflow works
The Visium CytAssist facilitates the precise transfer of transcriptomic probes for FFPE or fresh frozen tissue samples. In this workflow, sectioning, tissue preparation, staining (H&E or immunofluorescence), and imaging are performed on standard glass slides. After probe hybridization, the standard slides and a Visium slide with two Capture Areas are positioned in the CytAssist instrument, aligning the tissue sections over the Capture Areas. The instrument captures a brightfield image to provide spatial orientation for data analysis, followed by hybridization of transcriptomic probes to the Visium slide.
After CytAssist processing, the standard Visium workflow continues:
- Probe extension and cDNA synthesis – spatially barcoded probes are converted into complementary DNA.
- Library construction – cDNA is amplified and prepared for sequencing.
- Sequencing – libraries are sequenced using standard next-generation sequencing platforms.
- Data processing and analysis – sequencing data are processed with 10x Genomics software, mapping gene expression back to spatial positions on the tissue.
This integrated workflow enables high-fidelity spatial gene expression mapping while preserving tissue architecture, allowing researchers to study cellular organisation and interactions within intact tissue sections.
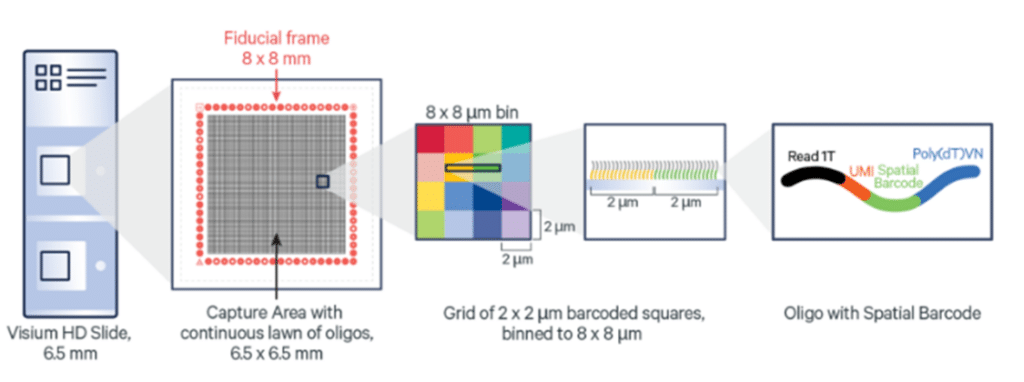
Visium HD slides: Capture areas optimised for single-cell analysis
Visium HD Spatial Gene Expression slides contain two 6.5 x 6.5 mm Capture Areas with a continuous lawn of oligonucleotides arrayed in ~11 million 2 x 2 μm barcoded squares without gaps, achieving single cell–scale spatial resolution. The data is output at 2 μm, as well as multiple bin sizes. The 8 x 8 μm bin is the recommended starting point for visualization and analysis.
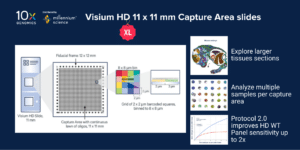
NEW Visium HD XL: 11 x 11mm Capture Area slides
The new 11 x 11 mm Capture Area slides provide all the benefits of HD slide architecture, now with ~3x more tissue coverage and over 30.5M barcodes organized in continuous 2×2 um squares.
- Explore larger tissues sections
- Analyze multiple samples per capture area
- The new Protocol 2.0 improves HD WT Panel sensitivity up to 2x depending on sample preservation method
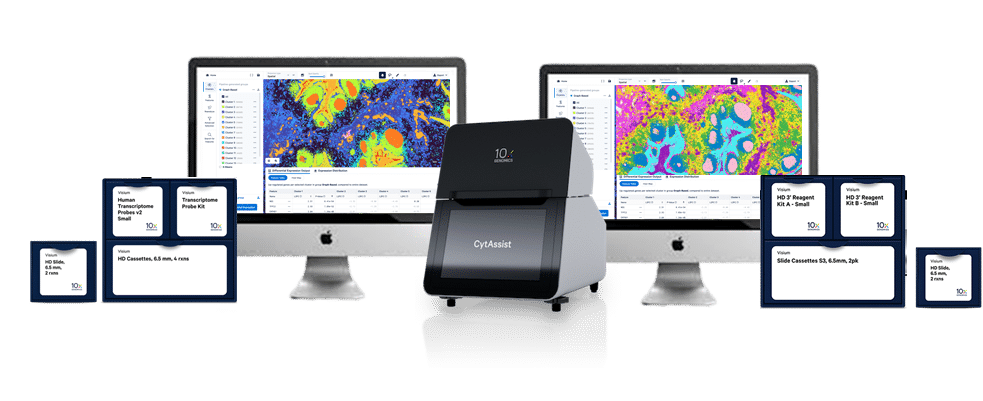
Visium Spatial transcriptomics solutions
Visium HD WT Panel Gene Expression
Protein coding gene coverage
- Hybridisation – targeted probe sets designed to capture transcripts
- Recommended assay for differential gene expression in human and mouse
- Most flexible tissue compatibility
- Most sequencing-efficient Visium HD assay
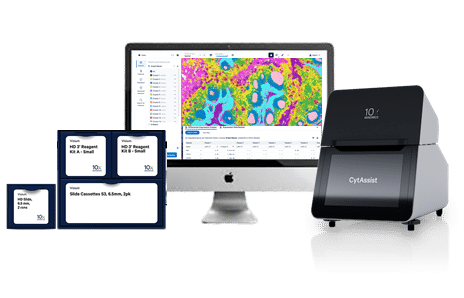
Visium HD 3’ Gene Expression
Whole transcriptome coverage
- Sequencing-based poly(A) capture – unbiased capture of mRNA 3’ ends
- Recommended assay for expanded discovery applications
- Most diverse species compatibility
- De novo discovery, including feasibility for isoforms, TCRs/BCRs, and more
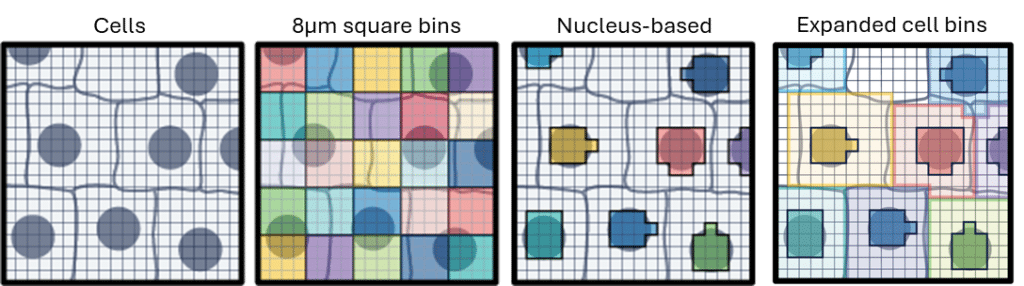
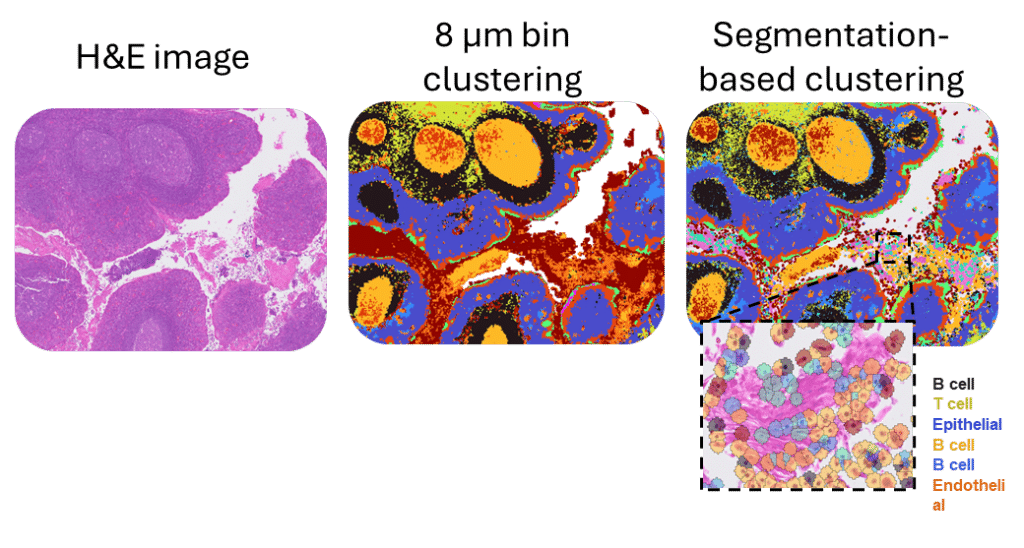
Enhancing Visium HD with nuclei-based cell segmentation
Nuclei-based cell segmentation leverages high-resolution H&E microscopy images to assign Visium HD barcodes to individual cell nuclei. Instead of aggregating barcodes into conventional fixed square bins, this approach segments nuclei from the microscopy image and groups the underlying barcodes corresponding to each nucleus, creating expanded cell bins that generate gene expression profiles at the single-cell level. By using actual nuclear boundaries, this method refines spatial gene expression data and improves biological interpretation compared with traditional square-binning approaches.
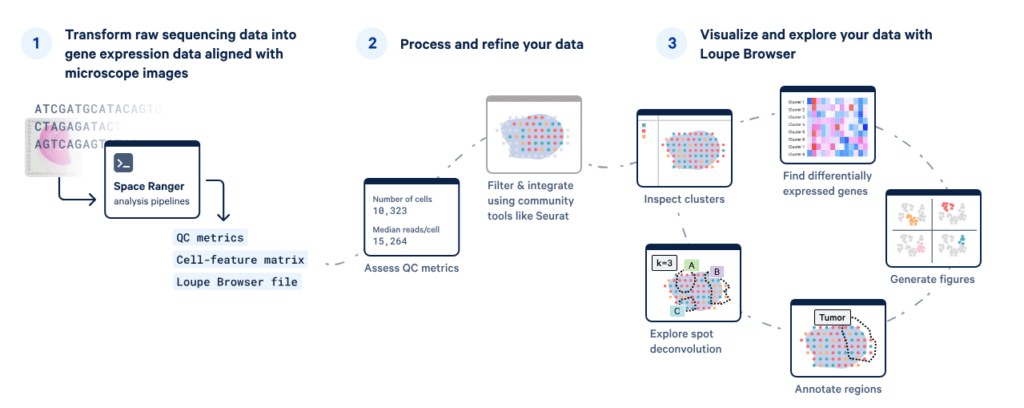
Visium spatial data analysis with Space Ranger and Loupe Browser
The Visium workflow transforms raw sequencing data into spatially resolved gene expression maps using Space Ranger, with QC and integration performed in tools like Seurat. Processed datasets can then be explored in Loupe Browser to visualise cell clusters, spot composition, differentially expressed genes, and annotated tissue regions — delivering actionable insights and publication-ready figures.
Speak to a Visium Spatial specialist
On this page
- Spatial Transcriptomics with 10x Genomics Visium Platform
- The Visium Spatial Gene Expression platform
- Visium CytAssist
- How the Visium Spatial workflow works
- Visium HD slides: Capture areas optimised for single-cell analysis
- NEW Visium HD XL: 11 x 11mm Capture Area slides
- Visium Spatial transcriptomics solutions
- Enhancing Visium HD with nuclei-based cell segmentation
- Visium spatial data analysis with Space Ranger and Loupe Browser
- Speak to a Visium Spatial specialist