Cytokines are small signalling proteins that regulate communication between immune cells during infection, inflammation, tissue repair, and immune homeostasis. They influence processes such as cell activation, differentiation, migration, and survival, making them central to both innate and adaptive immunity. Dysregulated cytokine signalling is also associated with autoimmune disease, chronic inflammation, and cancer.
As cytokine biology becomes increasingly complex, researchers require robust tools to study signalling pathways, cytokine activity, and immune responses with reproducibility and confidence.
Free Download: Get InvivoGen’s Cytokines Practical Guide featuring cytokine signalling pathways, reporter cell line references, recombinant cytokine tools, and antibody workflows.
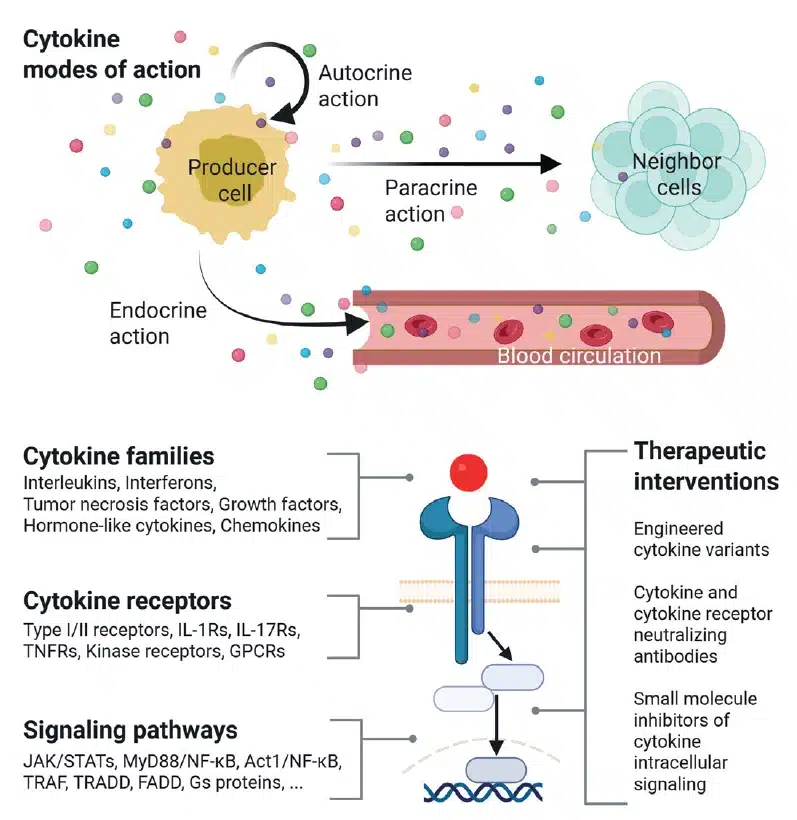
Cytokines function through receptor-mediated signalling pathways that coordinate immune responses across multiple cell types. Depending on the cytokine family and cellular context, signalling may involve pathways such as JAK-STAT, NF-kB, MAPK, Smad, or IRF activation.
Cytokines are commonly grouped into several major families including:
Interleukins (ILs)
Interferons (IFNs)
Tumour necrosis factor-related cytokines (TNFs)
Growth and colony-stimulating factors
Chemokines
Hormone-like cytokines
These signalling networks are highly dynamic due to cytokine pleiotropy, redundancy, synergism, and antagonism. Understanding these interactions is essential for immunology, inflammation, oncology, and therapeutic development research.
Reporter Cell Lines for Cytokine Research
Reporter cell lines are widely used to investigate cytokine signalling and evaluate immune pathway activation in functional assays.
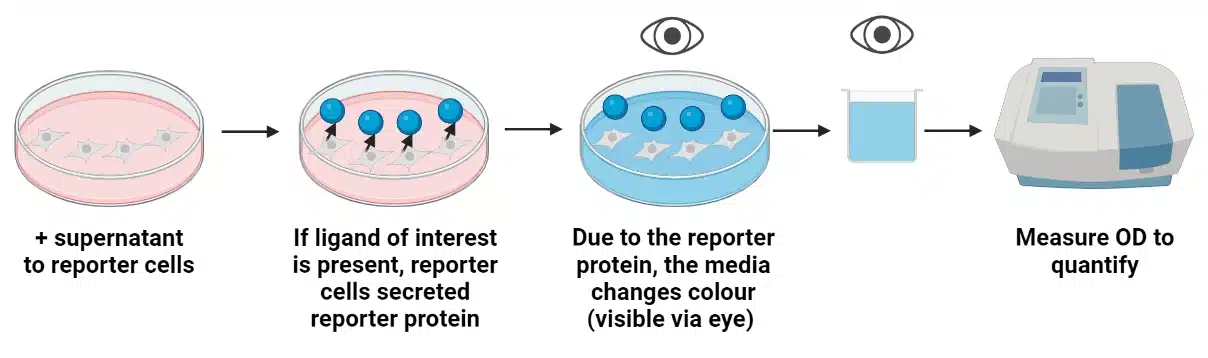
InvivoGen’s HEK-Blue™ cytokine reporter cell lines are engineered to respond to specific signalling pathways including STAT, NF-kB, and Smad activation. These cell-based assays use a SEAP reporter system to provide a simple colourimetric readout of cytokine activity.
Applications include:
cytokine bioactivity testing
pathway analysis
neutralisation assays
agonist and antagonist screening
therapeutic candidate evaluation
The HEK-Blue™ portfolio includes reporter cell lines for IL-1β, IL-6, IL-17, IFN-γ, TNF-α, TGF-β, TSLP and many other cytokine pathways.
Recombinant Cytokines in Functional Assays
Recombinant cytokines are commonly used to model immune activation and study cytokine-dependent cellular responses under controlled experimental conditions.
Depending on the application, cytokines may be produced in bacterial or mammalian expression systems. E. coli-derived cytokines are often used in early-stage assay development and antibody screening, while mammalian-expressed cytokines provide more native folding and post-translational modifications such as glycosylation.
InvivoGen’s recombinant cytokine collection includes interleukins, interferons, TNF-family cytokines, growth factors and colony-stimulating factors. Each cytokine is functionally validated using matched reporter assays to confirm bioactivity and assay performance.
Neutralising Antibodies for Cytokine Modulation
Neutralising antibodies are valuable tools for studying cytokine function and receptor-mediated signalling. By selectively blocking cytokine activity, researchers can investigate the role of specific pathways in inflammation, immune regulation, and disease progression.
InvivoGen provides recombinant monoclonal antibodies targeting cytokines and cytokine receptors involved in pathways such as IL-1, IL-6, IL-17, TNF-α, TGF-β, IFN and TSLP signalling.
These reagents are commonly used in:
Cytokine neutralisation assays
Pathway inhibition studies
Bioactivity assays
Therapeutic antibody research
InvivoGen’s neutralising antibody portfolio includes several recombinant monoclonal antibody formats designed for different research applications. These include biosimilar antibodies based on existing therapeutic candidates, modified-isotype biosimilars, proprietary in-house monoclonal antibodies developed when no biosimilar exists, and InvivoFit™ antibodies specifically adapted for in vivo studies with enhanced quality control standards.
Download the Cytokines Practical Guide
The InvivoGen Cytokines Practical Guide provides a consolidated reference for researchers studying cytokine biology and immune signalling pathways.
The guide includes:
cytokine family summaries
signalling pathway diagrams
reporter cell line references
recombinant cytokine overviews
neutralising antibody resources
cytokine assay examples
It is particularly relevant for researchers working in immunology, inflammation, oncology, infectious disease, and therapeutic development.
Making Every Cell Count: How the CAVA Lab Uses Mabtech FluoroSpot in Vaccine Research
Clinical trial samples are precious, particularly when researchers need to investigate multiple aspects of the immune response from a limited number of cells.
At RMIT University’s Cancer, Ageing and Vaccines Laboratory (CAVA Lab), researchers are using the Mabtech FluoroSpot FLEX: Human IFN-γ/IL-10 assay to simultaneously investigate different T cell responses following COVID-19 immunisation. By measuring two cytokines from the same sample, the team can gain more information while conserving valuable clinical trial material.
From cancer to vaccines: Meet the CAVA Lab
Led by Distinguished Professor Magdalena Plebanski, the CAVA Lab uses insights from immunology to address health needs across cancer, vaccination and healthy ageing.
The laboratory’s research spans several areas, including improving the early detection and personalised treatment of ovarian cancer, developing new immunotherapies and gold-based compounds, and investigating how ageing, gender, diet and mood influence the immune system.
Vaccination is another major area of focus. Researchers within the CAVA Lab are working to improve COVID-19 and influenza vaccines for vulnerable populations, including older adults and pregnant women. The team uses ‘omics’ approaches to profile immunity across multiple large-scale human clinical trials and is also developing synthetic nanoparticle vaccines using novel nanoparticle and adjuvant combinations.
Understanding T cell responses following COVID-19 immunisation
One area of the CAVA Lab’s research focuses on understanding T cell responses following COVID-19 immunisation.
Two cytokines of interest are IFN-γ and IL-10. The team uses IFN-γ production as an indicator of CD4 Th1 and CD8 Tc1 responses, while IL-10 indicates Tr1 activity. Measuring both therefore allows researchers to investigate different aspects of the T cell response.
The challenge is that clinical trial samples can provide a limited number of cells, making it important to maximise the information generated from every sample.
Why the CAVA Lab chose Mabtech FluoroSpot
The CAVA Lab has a long-standing connection with ELISpot, with Distinguished Professor Plebanski having been involved in pioneering the assay.
For its current research, the team selected the Mabtech FluoroSpot FLEX: Human IFN-γ/IL-10 assay because it enables both cytokines to be measured simultaneously from the same sample.
“We have a historical relationship with the ELISpot assay as our lab head was instrumental in pioneering the assay. We used this assay in particular to be able to measure both cytokines simultaneously using the same samples.”
This multiplex capability is particularly valuable when working with human clinical trial material, where every sample matters.
Making every cell count with multiplex cytokine detection
Using alternative methods, the CAVA Lab may need to measure IFN-γ and IL-10 separately. That can create a practical challenge when researchers are unable to recover enough cells from clinical samples to run multiple individual analyses.
FluoroSpot allows the team to investigate both cytokines simultaneously. As the CAVA Lab explains:
“Using other methods we would likely need to measure each analyte separately, and it can be difficult to recover enough cells from clinical samples to do this. This assay essentially halves the number of cells required.”
For the team, the ability to detect multiple cytokines simultaneously has been one of the most valuable aspects of the assay because clinical trial samples are precious and irreplaceable.
Rather than dividing a limited sample across separate cytokine measurements, multiplex FluoroSpot enables the researchers to extract more information from the cells available to them.
Supporting the PICOBOO clinical trial
The CAVA Lab is currently applying the Mabtech IFN-γ/IL-10 FluoroSpot assay as part of the PICOBOO clinical trial. The PICOBOO T cell study team is led by Dr. Kirsty Wilson, who together with Dr. Monica Prakash and Ms. Georgia Goodchild has created an optimised workflow to test T cell responses to multiple target peptide epitopes in vaccines.
Within this research, FluoroSpot provides the team with a practical way to investigate IFN-γ and IL-10 responses while conserving limited clinical samples. The ability to examine both cytokines simultaneously supports the laboratory’s broader goal of understanding immune responses following COVID-19 immunisation.
More insight from precious clinical samples
For the CAVA Lab, the value of Mabtech FluoroSpot comes down to making better use of an irreplaceable resource: clinical trial samples.
By simultaneously detecting IFN-γ and IL-10, the assay reduces the number of cells required compared with measuring each analyte separately and enables the researchers to investigate multiple aspects of T cell immunity from the same sample.
For researchers working with limited samples and looking to investigate multiple cytokines at the single-cell level, Mabtech FluoroSpot provides a multiplex approach to getting more information from every sample.
Interested in incorporating FluoroSpot into your immunology research?
Talk to the Millennium Science team about Mabtech FluoroSpot assays and how they could fit into your experimental workflow.
Planning an upcoming grant application?
The Millennium Science – 10x Genomics Grant Value Multiplier Program is designed to help Australian and and New Zealand Early and Mid Career Researchers (EMCRs) incorporate single cell and spatial biology into upcoming grant applications and get more value from their research funding.
Register your eligible grant project before submission and include 10x Genomics consumables in your proposed grant budget. If your grant is successfully awarded, you could receive an additional 50% in eligible 10x Genomics consumable value, helping you expand the scope and impact of your research.
Register your grant project using the form below:
Turn your grant funding into more research
Turn your grant funding into more research Receive an additional 50% in eligible 10x Genomics consumable value, with no maximum cap.
The Grant Value Multiplier scales with your qualifying 10x Genomics purchase. The more eligible 10x Genomics consumables included in your successful grant, the greater the additional value you can unlock.
For example only:
Planning $20,000 of eligible 10x Genomics consumables in your grant? $20,000 grant budget + $10,000 Grant Value Multiplier = $30,000 total potential 10x Genomics consumable value
That additional value could help you analyse more samples, explore more biology or extend the scope of your study, without increasing the 10x Genomics budget requested in your grant.
Who is eligible?
The program is open to Australian and New Zealand researchers and research teams preparing eligible competitive research grant applications. Early and Mid Career Researchers (EMCRs), as defined by the relevant funding scheme or institution, are particularly encouraged to apply.
You may be eligible if you:
• Are an Australian and New Zealand based researcher or research team
• Are preparing an eligible competitive research grant application
• Plan to include eligible 10x Genomics consumables in your proposed project budget
• Register your project with Millennium Science before submitting your grant application
• Proceed with the eligible 10x Genomics purchase if your grant is successfully awarded
Relevant funding opportunities may include ARC, NHMRC and MRFF schemes, as well as eligible university seed and pilot grants, philanthropic grants and disease specific research funding.
Not sure whether your grant is eligible? Register your interest and our team can help.
How it works
1. Register your grant project
Tell us about your research, funding scheme and submission deadline.
2. Plan your 10x Genomics component
Our team can help you scope the technology, experimental requirements and indicative budget.
3. Prepare your grant budget
Work with our team to determine indicative 10x Genomics requirements and obtain a quote for your grant application.
4. Include 10x Genomics in your grant application
Submit your application with eligible 10x Genomics consumables included in your proposed project budget.
5. Let us know when your grant is awarded
Once your successful grant and eligible purchase are confirmed, your project can proceed through the Grant Value Multiplier process.
6. Unlock additional research value
Receive additional eligible 10x Genomics consumables equivalent to 50% of the qualifying purchase value, subject to program terms and conditions.
More than a funding multiplier
You don’t need to have every detail of your experiment worked out before you register.
Before submission, Millennium Science and 10x Genomics can connect you with support to help plan the 10x Genomics component of your grant, including:
• Experimental scoping based on your research question
• Single cell and spatial technology selection
• Study design and sample planning
• Indicative consumable requirements and quotation support
• Technical resources and relevant publications
• Access to local service providers and core facilities where required
• 1:1 Grant Planning Sessions with our sales and technical teams
Our goal is to help you build a scientifically appropriate and realistically budgeted 10x Genomics component into your proposal.
Planning an upcoming grant?
Whether you’re planning your first single cell experiment, adding spatial biology to an established research program, or looking to increase the scale of your next study, start the conversation before you submit your application.
Register your grant project using the form below:
Have a project in mind but aren’t sure what to include in your grant? Request a 1:1 Grant Planning Session to discuss your project with the Millennium Science and 10x Genomics team.
Eligibility criteria, eligible products, qualifying grant schemes, purchase requirements and redemption periods apply. Participation and multiplier value are subject to approval under the final program terms and conditions. Atera reagents are excluded from the Grant Value Multiplier Program.
More Signal, Less Noise: Meet the Azure Cielo Real-Time PCR System
There is no shortage of qPCR systems on the market. Most labs already have one, and many have been running the same platform for years. So when a genuinely different approach to real-time PCR comes along, it’s worth paying attention.
The Cielo Real-Time PCR System from Azure Biosystems is now available through Millennium Science across Australia and New Zealand. Built around a novel fibre optic detection architecture, the Cielo rethinks how fluorescence is delivered and captured at the well level, translating into meaningful improvements in sensitivity, reproducibility, and multiplex capability.
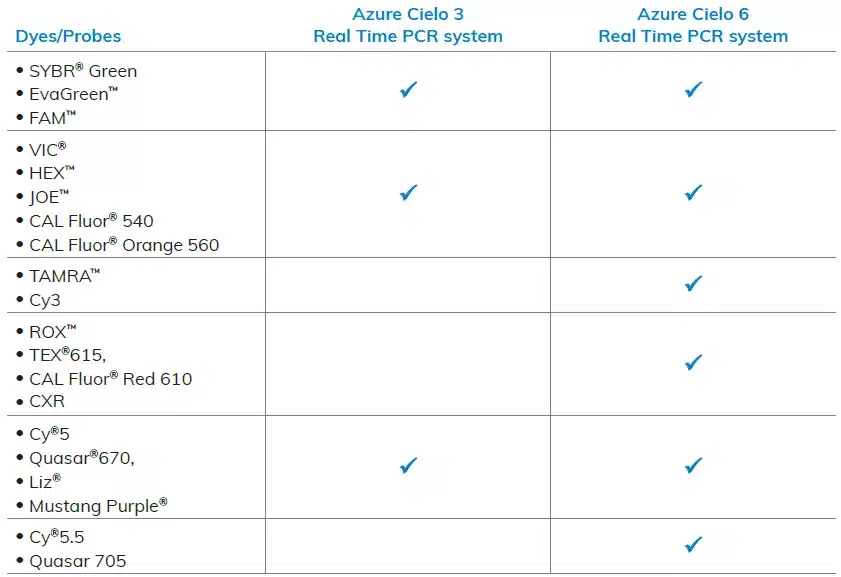
The Cielo is available in two configurations: the Cielo 3 (3-channel) for singleplex and lower-plex workflows, and the Cielo 6 (6-channel) for full multiplex experiments across the compatible dye spectrum.
The Problem with Whole-Plate Optics
Most conventional qPCR systems use a single illumination source that floods the entire plate. The light that misses the wells becomes background, the light path length varies from well to well, and the system compensates by requiring a passive reference dye like ROX to normalise those inconsistencies.
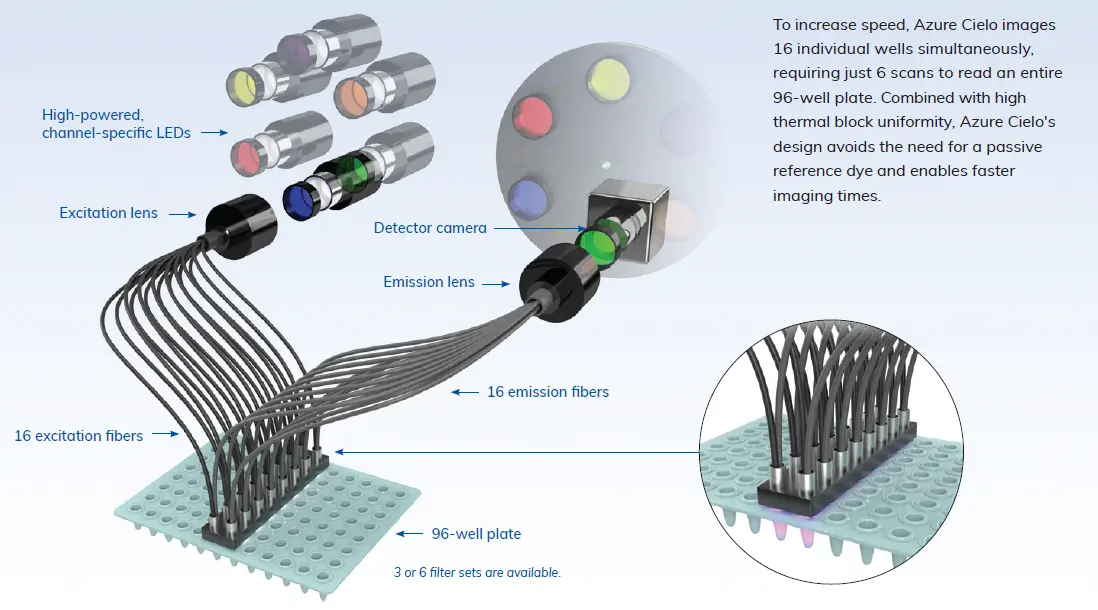
The Azure Cielo takes a different approach. A scan head comprising two sets of 16 fibre optics delivers excitation light directly into each individual well and collects emission from the same position. No light falls outside the well, and the path length is identical for every well.
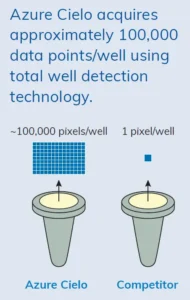
Additionally, the Cielo’s total well detection technology captures approximately 100,000 data points per well, compared to the single pixel acquired by conventional scanning systems.
No ROX. One More Channel for What Matters.
Because the Cielo’s optical design ensures uniform illumination well-to-well, there is no need to sacrifice a channel to a passive reference dye. ROX is simply not required.
For the Cielo 6, that means all six fluorescence channels are available for biological targets. The validated dye and probe panel includes:
Custom dyes and probes are also supported and can be easily calibrated to suit your workflow.
Performance That Holds Up Where It Counts
Sensitivity, speed, and reproducibility are the three things researchers demand most from a qPCR system. The Cielo delivers on each, and the fibre optic architecture is what connects all three.
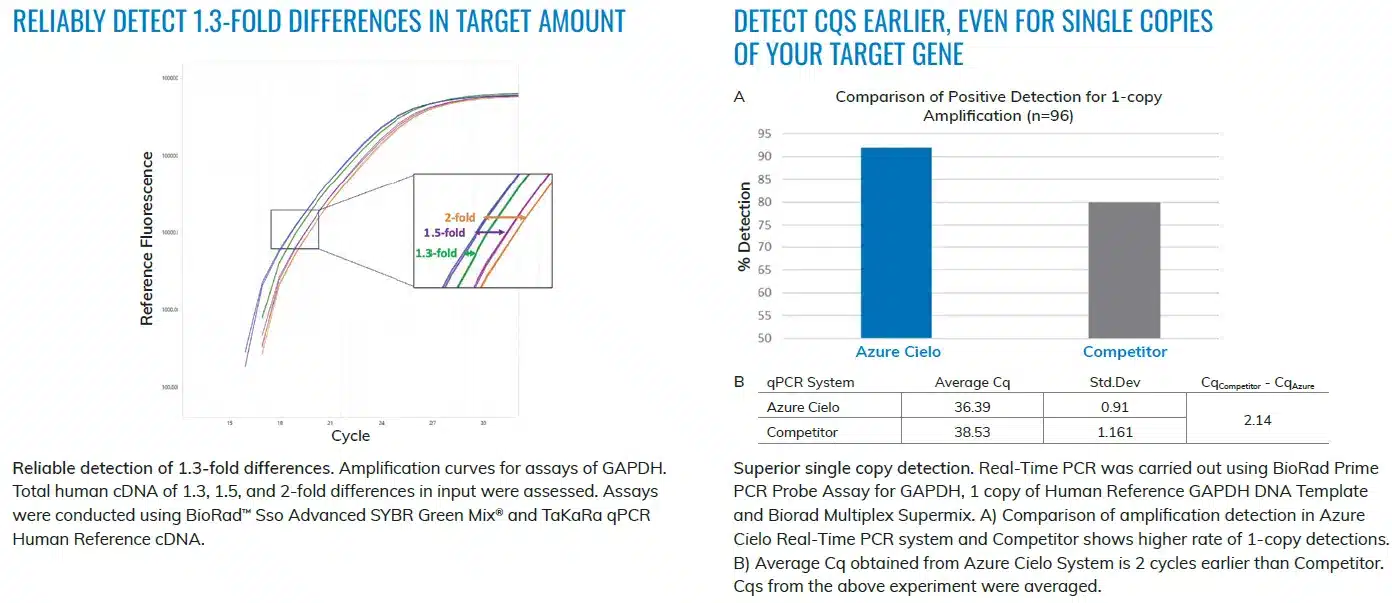
On sensitivity, the in-well detection design reduces background and increases excitation efficiency, enabling detection of single-copy templates and resolution of subtle differences in gene expression that conventional systems would miss.
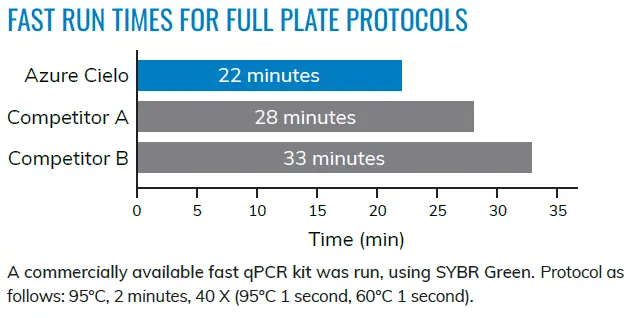
On speed, simultaneous scanning of 16 wells means the Cielo requires just 6 scan positions to read an entire 96-well plate across all six channels, completing a full plate scan in 9 seconds. Combined with the Peltier-based thermal block and fast ramp rates, total run times are competitive with the fastest systems on the market.
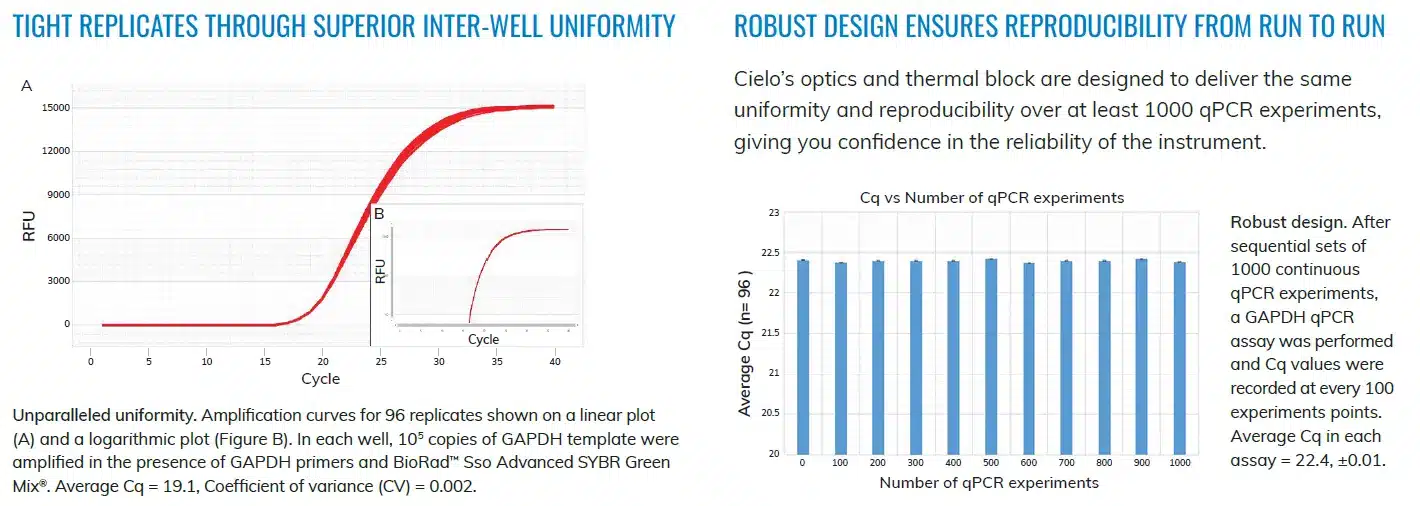
On reproducibility, the same thermal uniformity and optical consistency that eliminates the need for ROX also ensures that Cq values remain stable run-to-run and instrument-to-instrument. This is particularly relevant for multi-site studies or labs running multiple units.
Software Designed for the Bench, Not the IT Department
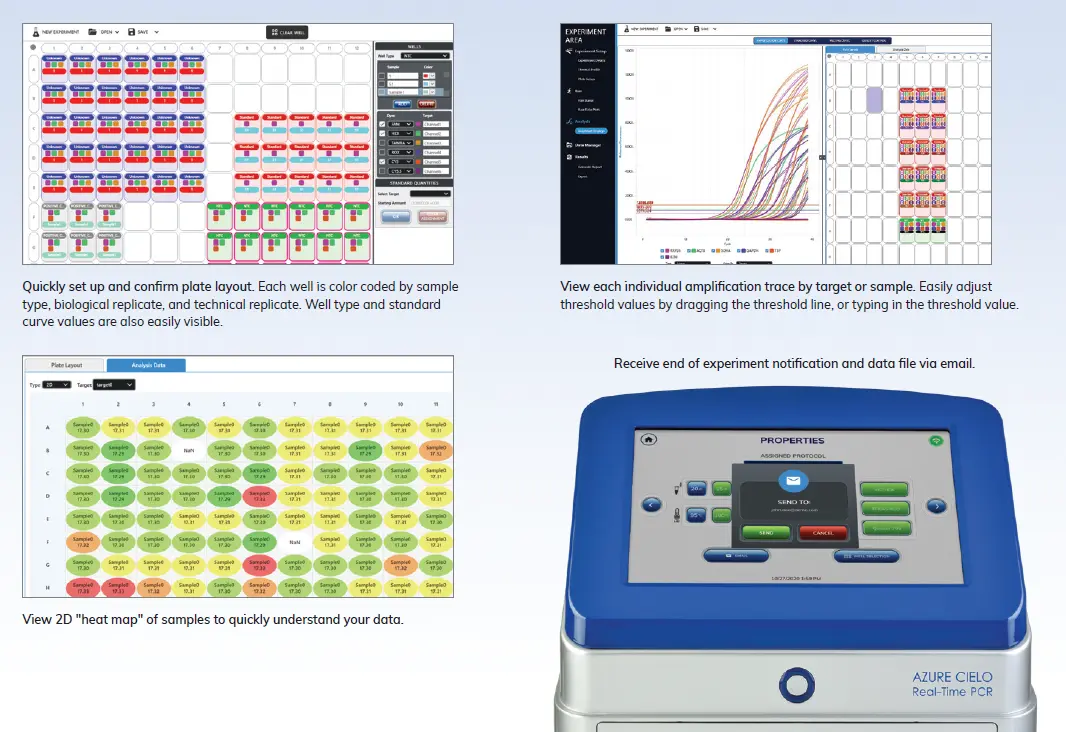
The Cielo runs from an integrated 10.3″ touchscreen with no external PC required. Protocols are saved and recalled directly from the instrument. Email notifications are sent automatically at run completion, with data accessible via Wi-Fi, Ethernet, or USB.
The companion Azure Cielo Manager software provides a full PC-compatible analysis environment, supporting dye/SYBR quantification, probe-based quantification, allele discrimination, comparative quantitation, and high-resolution melting. Plate layouts are colour-coded by sample type, replicate, and well ID for rapid visual QC. Data can be exported to MS Office, PDF, or in RDML format (the MIQE-preferred standard for qPCR data interchange). The onboard 32GB memory stores the equivalent of 20,000 experiments.
Azure Cielo at a Glance
Fibre optic in-well excitation and detection for reduced background and improved sensitivity
~100,000 data points captured per well
No passive reference dye required, freeing all channels for biological targets
3-channel (Cielo 3) and 6-channel (Cielo 6) configurations available
1.3-fold resolution of gene expression differences in singleplex reactions
Single-copy detection sensitivity
10-log dynamic range
12 independent temperature zones with 40°C gradient range
Full 96-well plate scan across 6 channels in 9 seconds
Touchscreen-operated with standalone capability
Wi-Fi, Ethernet, and USB connectivity with email run notifications
RDML, PDF, and MS Office data export
Ready to See it in Action?
The Azure Cielo is available now through Millennium Science across Australia and New Zealand. Complete the form below, and a member of our team will be in touch promptly.
Artificial intelligence seems to be everywhere these days. Whether it’s helping us navigate unfamiliar cities, translating languages in real time, or recommending what to watch next, AI is rapidly becoming part of everyday life.
But what about the laboratory? For many researchers, image analysis remains one of the most time-consuming parts of an experiment. Hours can be spent adjusting thresholds, optimising segmentation settings, and checking that cells have been identified correctly. Even then, results can vary depending on who performs the analysis or which laboratory generated the data.
What if all of that could happen automatically, with a single click? That’s exactly what Agilent has delivered with the latest AI-powered update for the Agilent xCELLigence RTCA eSight.
From Manual Analysis to Intelligent Automation
The new RTCA eSight AI software introduces deep learning-powered cell segmentation that automatically identifies and quantifies cells directly from brightfield images.
No manual thresholding.
No endless parameter tweaking.
No subjective decisions about what counts as a cell.
Instead, the software uses pre-trained AI models to consistently analyse images across experiments, users and even different research sites.
The result? Faster analysis, greater confidence and significantly improved reproducibility.
Label-Free Means Happier Cells
Traditionally, researchers often rely on fluorescent dyes or stains simply to count cells or assess morphology. While effective, these approaches can add cost, increase assay complexity and sometimes alter normal cell behaviour.
The RTCA eSight AI workflow changes this by accurately segmenting cells directly from brightfield images, completely label-free.
Researchers can now perform routine cell counting, proliferation studies and morphology analysis without introducing additional reagents or disturbing their cells.
And when fluorescence is required? It integrates seamlessly.
Researchers can combine brightfield AI segmentation with fluorescent markers to classify individual cell populations, opening the door to applications such as:
Live/dead cell analysis
Phagocytosis assays
Cell phenotype classification
Fluorescence intensity measurements at the single-cell level
It’s the best of both worlds: non-invasive imaging when you want it, fluorescence when you need it.
Up to 80% Faster Image Analysis
Let’s be honest, nobody became a scientist because they enjoy manually analysing hundreds of images. One of the standout benefits of the new software is speed.
Agilent reports that AI-powered analysis can reduce image analysis time by up to 80%, allowing complete 96-well plates to be processed in just minutes.
That means less time sitting in front of a computer and more time:
Designing the next experiment
Interpreting biological results
Publishing your findings
Heading home at a reasonable hour!
For busy laboratories running multiple projects or high-throughput screens, those time savings quickly add up.
Two Independent Measurements. One Complete Story.
One feature that has always made the xCELLigence RTCA eSight unique is its ability to combine real-time impedance measurements with live-cell imaging.
Now, AI makes that combination even more powerful.
Researchers can simultaneously monitor:
Cell proliferation
Cell attachment
Cell morphology
Cell health
Individual cell numbers
Because impedance and imaging measure biology in different ways, they provide complementary datasets that strengthen confidence in your conclusions.
Rather than relying on a single endpoint measurement, researchers gain continuous, orthogonal validation throughout the entire experiment.
The Future of Image Analysis Has Arrived
Artificial intelligence isn’t replacing researchers, it’s removing repetitive tasks that slow research down.
By automating cell segmentation and standardising image analysis, Agilent’s new RTCA eSight AI software allows scientists to spend less time processing data and more time asking the important biological questions.
After all, the next breakthrough probably won’t come from manually adjusting segmentation thresholds. It will come from the discoveries made once you no longer have to!
If you’d like to learn more about the new AI-powered capabilities of the Agilent xCELLigence RTCA eSight, or arrange a demonstration, feel free to get in touch with the Millennium Science team. We’d love to show you how AI can simplify your next live-cell imaging experiment.
Discover how single cell spatial biology is transforming our understanding of colorectal cancer.
The Xenium platform enables researchers to profile gene expression directly within intact tissue, preserving the spatial relationships between tumour, immune and stromal cells that drive disease progression.
Why study colorectal cancer with Xenium?
Bulk sequencing averages signals across thousands of cells.
Xenium reveals individual cells within their native tissue architecture, allowing researchers to investigate:
• Tumour heterogeneity
• Immune excluded regions
• The invasive tumour front
• Cell neighbourhoods
• Spatial biomarker expression
• Tumour immune interactions
Why Xenium?
✓ Single cell, subcellular resolution• Tumour heterogeneity
✓ Spatial context preserved
✓ FFPE compatible
✓ Human Colon Gene Expression Panel
✓ Custom add-on panels
✓ RNA and protein profiling on the same tissue section
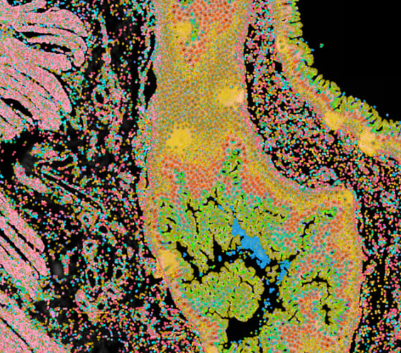
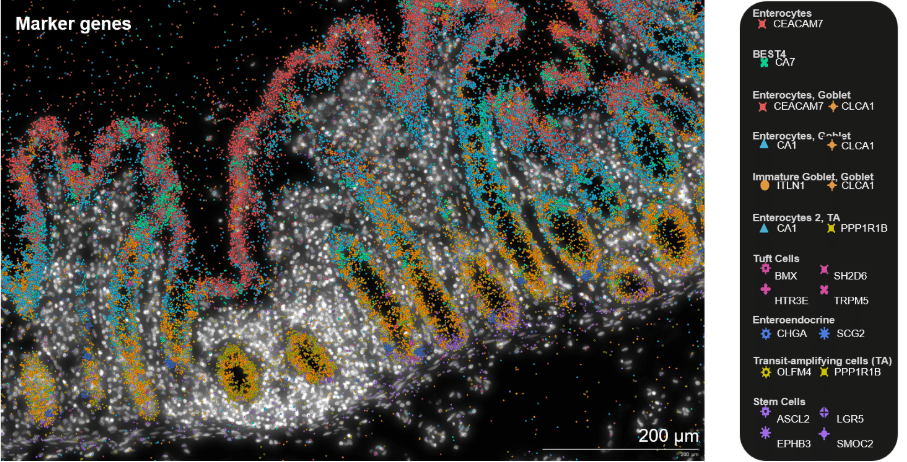
Xenium spatial transcriptomic analysis of CRC FFPE tissue. (A) RNA transcript density. (B) Multiplexed protein detection via immunofluorescence. (C) RNA clustering. (D) Post-Xenium H&E.

Formalin-fixed, paraffin-embedded (FFPE) human colorectal cancer (CRC) samples were analyzed using the Xenium Human Colon Gene Expression Panel, supplemented with 53 Immuno-Oncology–specific genes, and stained with all Xenium Protein subpanels. Over 1.7 million cells were profiled for both RNA and protein expression.
I’ve saved this topic for last because it’s less of an observation and more of a personal perspective, one I’d happily discuss over a coffee.
The Risk of Profiling Without Purpose
Across both conferences, the direction was clear: researchers want more data types from more compartments, using less of their precious samples. Multiomics integration is the expectation. The technology to deliver on that expectation is maturing rapidly.
But sitting through multiple sessions on multiomic workflows, I kept thinking about a distinction that didn’t always get enough airtime: describing a system in ever-greater molecular detail is not the same as understanding it.
The papers that ultimately change clinical practice tend not to be the ones that profiled fifteen layers and presented a correlation heatmap. They’re the ones that identified a specific mechanism, validated it rigorously, and translated that understanding into something actionable, whether that’s a diagnostic marker, a therapeutic target, or a clinical decision.
Multiomic profiling is enormously valuable as a discovery tool. It’s how you find the signal. But the signal still needs to be followed up with focused, mechanistic work that tests whether the correlation is real, whether it’s causal, and whether it holds up across patient populations and experimental conditions.
I think the field sometimes risks conflating the ability to measure more with the ability to understand more. The distinction matters most when the goal is clinical translation.
The Spatial Bifurcation Proves the Point
This tension showed up concretely in the spatial proteomics landscape. As I discussed in Part 2, the field is bifurcating into high-plex discovery panels and low-plex clinical deployment panels. That bifurcation is essentially the field recognising this point: discovery needs breadth, but clinical translation needs depth.
Once you’ve used a hundred-marker panel to identify the seven targets that matter in a given tumour microenvironment, what pharma actually wants is a small, validated, reproducible panel that reads out those seven targets reliably across multiple clinical samples and sites. The value shifts from “how many markers can we measure” to “how well do we understand the ones that matter.”
That transition from discovery to deployment is where mechanistic understanding becomes essential. You can’t validate a clinical panel without understanding why those markers matter, how they interact, and what confounders might affect interpretation in a real-world clinical setting.
Looking Forward
In this series we covered multiomic convergence, spatial maturation, AI integration, the shift to human-relevant models, and now the case for mechanistic depth over breadth. These themes aren’t independent. They’re all aspects of a field that’s becoming more integrated, more translational, and more demanding in terms of rigour and reproducibility.
The decisions being made now about standards, validation, and infrastructure will determine how quickly these technologies reach routine clinical use. As I mentioned in Part 1, the scientists who shaped this field thought in decades. The challenges ahead deserve the same approach.
At Millennium Science, we attend conferences like FOG and EACR to understand where the field is heading, so we can make sure ANZ researchers have access to the tools and technologies that support their best work. If any of these themes resonate with your own research, we’d genuinely welcome the conversation.
Key Takeaways
Profiling more molecular compartments is valuable for discovery, but it doesn't substitute for mechanistic understanding.
The spatial proteomics bifurcation (high-plex for discovery, low-plex for clinical use) illustrates this principle in practice.
Clinical translation requires focused validation and mechanistic depth, not just data breadth.
The field is becoming more integrated, more translational, and more demanding. The tools and standards we build now will shape the next decade.
This is the third post in a series reflecting on themes from FOG (Boston) and EACR (Budapest). This post covers two themes that were less flashy than multiomics and spatial biology but are potentially more consequential in the long run: the integration of AI across the field, and a structural shift in the experimental models researchers are using.Both are less about new science and more about the shifting infrastructure underneath.
At FOG in particular, AI wasn’t confined to its own dedicated track. It was woven through virtually every session, across genomics, proteomics, drug discovery, pathology, and clinical data science. Assay automation, foundation models, agentic platforms, generative tools, and machine learning pipelines all featured across the full breadth of the programme.
The signal isn’t that AI is coming to biology. The signal now is that AI is assumed. It’s becoming infrastructure rather than innovation. The more interesting questions are about what AI currently can’t do well, and where the field’s enthusiasm is running ahead of its validation.
The hardest of those questions, and the one I kept hearing across both conferences: QC and standardisation of multi-modal data remains a genuine bottleneck. Sequencing data has well-established quality metrics (Q scores, coverage depth, error rates) that the field has spent two decades refining. High-content spatial imaging data doesn’t have equivalent consensus standards. Batch effects, optical artefacts, tissue quality variation, and registration errors all introduce noise that current QC frameworks handle inconsistently.
This matters because AI tools are only as good as the data they’re trained and validated on. If the underlying data quality standards aren’t solved, AI amplifies the noise rather than cutting through it. Whoever solves the reproducibility and validation problem at scale for spatial and multimodal imaging data will capture disproportionate value as the field translates into clinical use.
The Quiet Shift Away from Animal Models
Less visible than AI and multiomics, but very recognisable especially at EACR is that research is moving away from animal models toward more human-relevant systems. Organoids, in vitro tissue models, and banked human tissue are gaining ground as primary experimental targets.
This shift is being driven from multiple directions. Regulatory frameworks are increasingly permitting non-animal alternatives for preclinical testing, and the economics favour it. Animal studies are slow, expensive, and have well-documented translational failure rates. And the scientific argument is straightforward: if the goal is to understand human biology, starting with human material makes more sense than starting with a model organism and hoping the biology translates.
The technology ecosystem around this shift is responding faster than I’d expected. Plenty of new platforms for 3D cell culture, tissue engineering, and high-throughput organoid screening were visible across both conferences, from established companies and newer entrants alike. The infrastructure to support human-relevant preclinical research is being built now, and the pace suggests this is a structural shift rather than a passing trend.
These two themes (AI integration and the move to human-relevant models) might seem unrelated, but they share a common thread: both are about the foundations of how research gets done changing underneath the science itself. AI is reshaping the data infrastructure. Organoids and banked tissue are reshaping the experimental infrastructure. Together, they’re redefining what a well-equipped lab looks like.
Key Takeaways
AI is no longer a separate track at conferences. It's assumed infrastructure across every domain.
QC and standardisation of multimodal data, especially spatial imaging, is the bottleneck that matters most for clinical translation.
Research is structurally shifting from animal models toward organoids, in vitro systems, and banked human tissue.
Both shifts are about infrastructure, not just innovation, and they're reshaping how research is done at a foundational level.
Talk to our team about integrating new workflows
Interested in how these infrastructure shifts connect to your lab’s workflows? Whether it’s spatial data analysis, 3D cell culture, or automation, we’re here to help you navigate what’s next.
In this post, I want to unpack the two themes that dominated the scientific sessions at both conferences: the convergence of multiomic workflows, and the maturing spatial biology landscape.
A Single Data Layer Is No Longer Enough
The most consistent theme across both conferences. Researchers are looking for multiple molecular readouts from the same sample, and the general approach is shifting to expect it.
From the genomics side, sequence is increasingly a starting point rather than a destination. Methylation status, three-dimensional chromatin architecture, and RNA modifications are now treated as essential layers that sit alongside sequences. The range of assay chemistries addressing these layers has expanded noticeably, and the expectation is that a complete genomic picture includes epigenetic context, not just the linear sequence of bases.
At the sequence level itself, whole-genome sequencing (ideally diploid and phased) is slowly becoming the expectation over exome as the cost differential narrows. The information lost by sequencing only coding regions is becoming harder to justify when intronic, regulatory, and structural variant information is increasingly recognised as clinically relevant.
In addition to genomics and transcriptomics, the shift in focus to include proteins is becoming increasingly important, as proteins are the actual functional units of biology. As such, alternative top-down proteomics approaches are complementing traditional mass spectrometry, opening protein profiling to labs without dedicated proteomics infrastructure. Beyond proteins themselves, the field is increasingly profiling metabolomics and lipidomics alongside traditional proteomics, building toward a more complete molecular phenotype.
The boundaries between different biological compartments are blurring. Workflows that were previously siloed are converging, driven by both the scientific recognition that biology doesn’t operate with disciplinary boundaries, and the practical reality that sample material is often limited. The goal is to extract as many meaningful readouts as possible from each sample.
Spatial Biology: Maturing Toward the Clinic
Spatial transcriptomics and proteomics have been conference staples for several years, but the conversation at both FOG and EACR had clearly matured past raw capability and into practical deployment.
The spatial proteomics field in particular appears to be bifurcating. High-plex panels (10s to 100s of markers) are doing discovery work, casting a wide net to identify which proteins matter in each tissue context. But lower-plex panels (<10 markers) are emerging as the format that pharma and clinical labs actually want for deployment. A small, validated, reproducible panel gives a clearer answer in a clinical workflow than a hundred-marker discovery panel does.
Spatial methods more broadly are moving from research toward translational and clinical use, but the view from pharma is more measured than the hype. Several pharma-side speakers noted that spatial technologies validate digital pathology rather than replacing it, H&E staining remains the clinical gold standard, and that the current platforms aren’t quite mature enough for routine diagnostic use.
The structural gaps everyone points to are remarkably consistent: automation (too much hands-on time per sample), standardisation (too much variability between operators and sites), and analysis tools that hold up under industry reproducibility requirements.
None of this means spatial is overhyped. It means the field is in the transition phase between research tool and clinical infrastructure, which is the most interesting and consequential phase to be in.
Key Takeaways
A single data layer (sequence alone, protein alone) is no longer sufficient. Multiomic integration is the expectation.
Whole-genome sequencing is becoming the expectation over exome. Spatial proteomics is bifurcating into high-plex (discovery) and low-plex (clinical deployment) workflows.
Spatial methods are moving toward translational and clinical use, but automation, standardisation, and validated analysis tools remain the key gaps.
Working on multiomic or spatial workflows in your lab?
We’d be happy to discuss how these trends connect to the tools and platforms available in ANZ.
Hi, I’m Gerry Ma, Technology and Development Manager here at Millennium Science. I joined Millennium Science a few months ago, having come from commercial roles across the flow cytometry, single-cell genomics, and spatial transcriptomics fields. I now spend a good portion of my time talking to scientists and technology developers about where the field is heading and what tools ANZ researchers need to do their best work.
In early June, I attended two conferences back-to-back: the Festival of Genomics (FOG) in Boston, and the European Association for Cancer Research congress (EACR) in Budapest. Two very different audiences (genomics and AI in Boston; translational cancer research in Budapest), but the overlap in themes was more striking than the differences.
Field Signals
This is the first in a short series of Field Signals blogs where I’ll share what stayed with me. Not a comprehensive conference review, but the observations I kept coming back to upon returning home, and the ones I think matter most for how research is going to look over the next few years.
People Who Thought in Decades
Before diving into the technical themes, I wanted to share one personal highlight that set the tone for everything else.
At FOG, George Church (Harvard Medical School), Mark Adams (The Jackson Laboratory for Genomics Medicine), and Sorin Istrail (Brown University) discussed the future of genomics in a session that also served as a tribute to the late J. Craig Venter, who was originally meant to speak. Their conversation ranged across multiomics, in situ genomics, xenotransplantation, national-scale sequencing programmes, and the role of AI in biological data at population scale.
But what stayed with me was simpler than any of those topics. Watching three scientists who shaped the field reflect on the history of genomics and past conversations with Craig Venter was a reminder that the technologies we now take for granted were built by people who had genuine scientific progress as their primary motivation, and who thought in decades rather than quarters.
That framing stuck with me through both conferences. The decisions being made right now about how we integrate multiple data types from different platforms, how we standardise methods, and how we shift toward new experimental models are the decisions that will define the trajectory of the next decade of biological research. These decisions deserve the same kind of long-term thinking.
What's Coming in This Series
Over the next few posts, I’ll unpack the themes that came through most clearly:
Part 2 will cover the convergence of multiomic workflows and the maturing spatial biology landscape.
Part 3 looks at AI integration and a quieter but potentially more consequential shift in experimental models.
Part 4 wraps up with a personal perspective on why mechanistic depth still matters more than breadth.
Key Takeaway
The field is moving fast, but the most consequential shifts aren't always the most visible ones. This series is about the patterns underneath the headlines.
Follow Millennium Science on LinkedIn for the rest of the series.
Every day, researchers create extraordinary scientific images that rarely leave the lab or a conference presentation. Through the Lens of Discovery celebrates the beauty, creativity and impact of biological research across Australia and New Zealand. Whether it’s a stunning microscopy image, a colourful spatial transcriptomics map or an elegant data visualisation, we invite you to share the images that tell your scientific story.
Winning images will be featured in the 2027 Through the Lens of Discovery Calendar, showcasing the remarkable research and scientific visualisations created by our community. There is no need to choose a category. If your image tells a scientific story, we encourage you to submit it.
Entries should showcase or complement research enabled by 10x Genomics technologies. This may include images, microscopy, spatial maps or data visualisations generated using or supporting discoveries made with 10x Genomics platforms.
Need some inspiration? We welcome scientific images in all forms, including:
How does this image relate to research enabled by 10x Genomics technology?
Tag both:
@Millennium Science
@10x Genomics
Include the hashtags: #10xDiscoveryANZ #ScienceThroughTheLens #10xGenomics
Alternatively, submit your photo through our online entry form.
Timeline
Entries have been extended until 9 Nov 2026!
Winners Announced:15 Nov 2026
Judging Criteria
Entries will be judged by a panel of representatives from Millennium Science and 10x Genomics based on the following criteria:
Scientific impact (30%)
Creativity (30%)
Storytelling (20%)
Visual quality (20%)
Awards
7 Winners will receive:
A $50 Amazon Gift Card
Feature in The Cell Brief
Showcase across Millennium Science and 10x Genomics ANZ social media
Inclusion in the 2027 Through the Lens of Discovery Calendar
Rules
Only open to researchers, clinicians and students based in Australia or New Zealand.
Images must be original. Both published and unpublished images are welcome.
Image submission requirements
JPEG or PNG
Minimum 3000 px on the longest side (or 300 dpi)
Maximum three entries per person
AI-generated images are not eligible
Entrants must own the rights to the image. Entrants are responsible for obtaining permission from their supervisor, principal investigator or institution where required before submitting images.
Appropriate ethics and consent must have been obtained where required.
Images may have minor edits (brightness, contrast, cropping), but excessive manipulation is discouraged.
Entries must demonstrate, incorporate or relate to research enabled by 10x Genomics technologies.
By entering, participants confirm that their submission does not contain confidential or unpublished information that cannot be publicly shared, and grant Millennium Science and 10x Genomics permission to reproduce and feature their submitted images in the Through the Lens of Discovery Calendar and related promotional materials, with full credit provided to the creator.
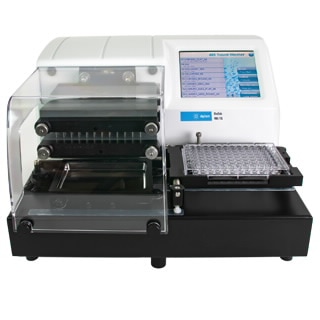
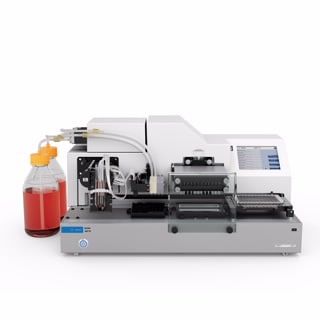
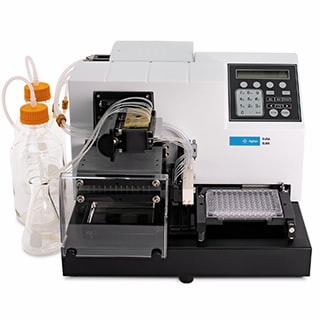
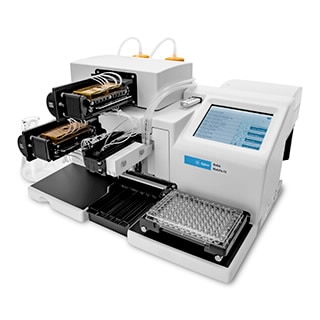
Agilent Liquid Handling & Microplate Instrument Portfolio: Choosing the Right Workflow Solution for Your Lab
Modern life science laboratories are under constant pressure to generate reliable data faster, improve reproducibility, and streamline increasingly complex workflows. From ELISA automation and nucleic acid quantification to high-throughput screening and live-cell analysis, selecting the right liquid handling and detection platform can significantly improve laboratory efficiency.
Agilent’s liquid handling and microplate instrumentation portfolio combines flexible automation, multimode detection, plate washing, dispensing, and workflow integration technologies designed to support research laboratories ranging from routine assay environments through to advanced high-throughput screening facilities.
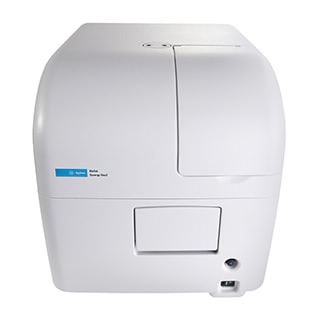
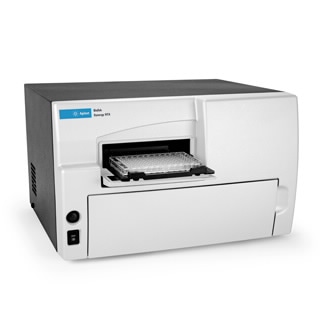
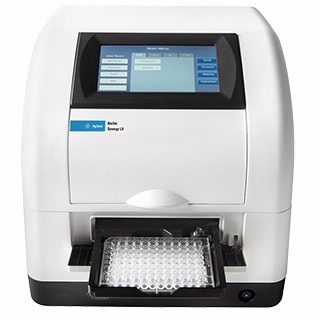
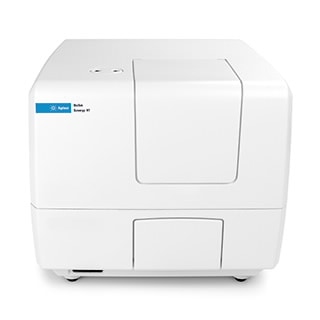
Agilent absorbance readers support routine laboratory workflows including ELISAs, protein assays, microbial growth studies, and nucleic acid quantification.
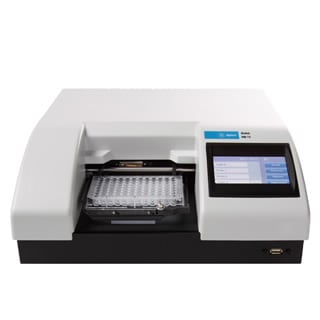
Agilent 800 TS Microplate Reader
The 800 TS is designed for straightforward absorbance workflows and cost-conscious laboratories requiring reliable performance for routine assays.
Key features
Reads wavelengths from 400-750 nm
Supports 6- to 384-well plates
Touchscreen interface with USB export
Optional temperature control and shaking
Gen5 software integration
Best-fit applications: ELISAs, Protein assays, Enzyme kinetics, Basic cell-based assays
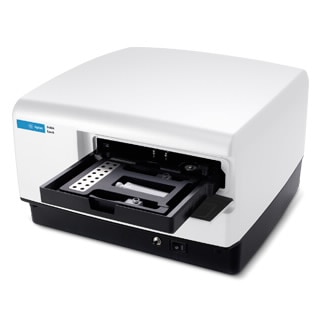
Agilent Epoch Microplate Spectrophotometer
The Epoch combines monochromator-based UV-Vis detection with flexible wavelength selection for nucleic acid and protein quantification workflows.
Key features
UV-Vis range from 200-999 nm
Compatible with Take3 micro-volume plates
Temperature control to 65 °C
Supports 6- to 384-well plates
Best-fit applications: DNA and RNA quantification, 260/280 and 260/230 purity measurements, Cytotoxicity assays, Cell proliferation studies, Enzyme kinetics
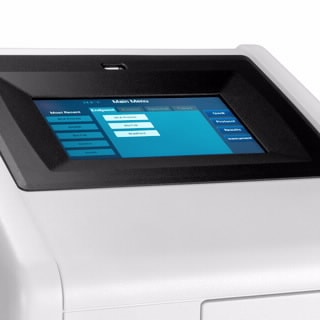
Agilent Epoch 2 Microplate Spectrophotometer
The Epoch 2 expands absorbance capabilities with stand-alone touchscreen operation and full-spectrum scanning functionality.
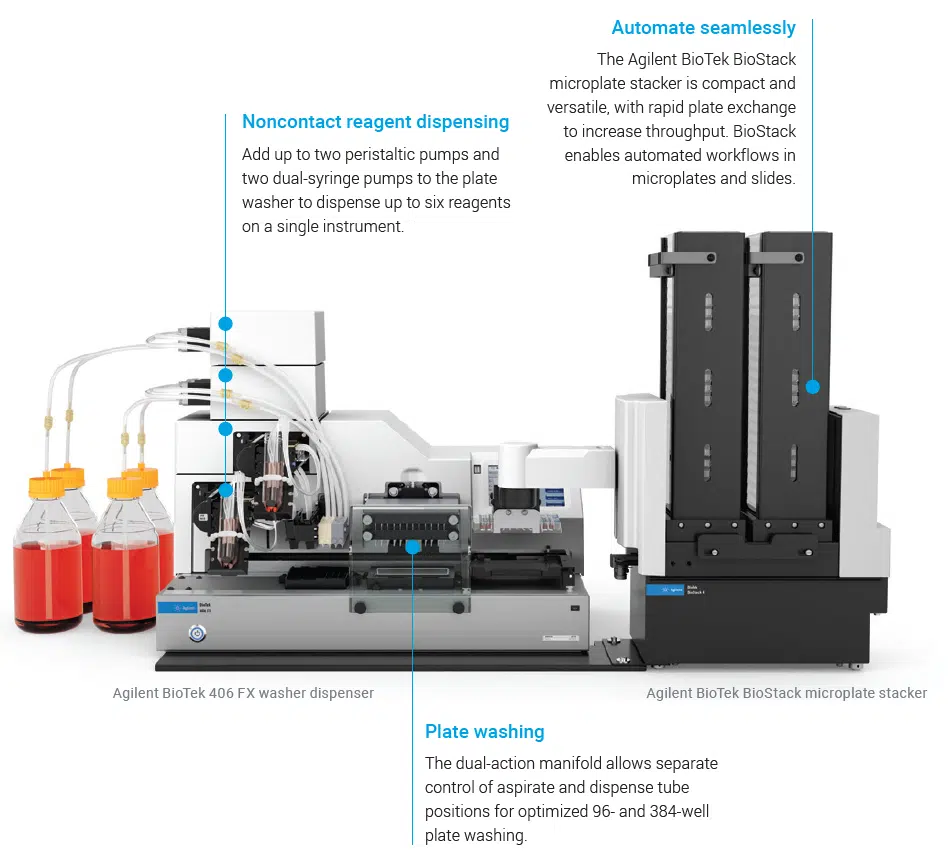
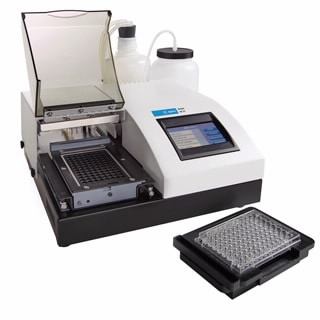
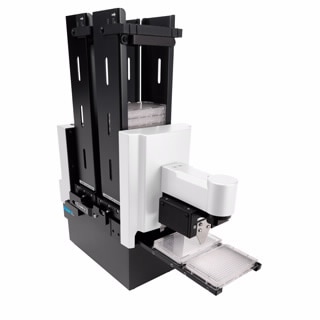
The BioStack automates plate loading and unloading for walk-away workflow automation.
Benefits
Fast plate exchange
Delidding and re-lidding support
Compatible with 6- to 1536-well plates
Enables unattended high-throughput processing
Supporting Modern Research Workflows
Agilent’s liquid handling and microplate instrumentation portfolio supports a wide spectrum of laboratory applications, from routine absorbance assays through to advanced automation and high-content workflows. With scalable solutions for washing, dispensing, detection, imaging, and plate automation, laboratories can build flexible workflows that improve reproducibility, efficiency, and throughput.
To discuss the best Agilent liquid handling workflow for your laboratory, contact the team at Millennium Science.
10x Genomics Clinician Researcher Accelerator Program
Clinical research is increasingly driven by the need to understand biological heterogeneity, identify actionable biomarkers, and link molecular mechanisms to patient outcomes. Traditional bulk and low-resolution approaches often mask clinically relevant signals, slowing discovery and translation. 10x Genomics technologies accelerate clinical research by enabling cell-resolved and spatially resolved insights at scale at earlier in the research pipeline.
A targeted Clinician Researcher Accelerator Program designed to support medically qualified clinician researchers in generating high-impact spatial and single-cell data, with dedicated support and preferential pricing to fast-track translational research.
The Clinician Researcher Accelerator Program is a limited-time initiative supporting medically qualified clinician researchers who are looking to integrate spatial transcriptomics and single-cell profiling into their research. Successful applicants will receive access to dedicated technical guidance, and preferential pricing to help generate robust pilot data for translational and clinically focused studies.
1. Resolving clinical heterogeneity at single-cell resolution
Many clinical samples including tumours, immune tissues, and biopsies, are highly heterogeneous. Bulk profiling averages signals across cell populations, obscuring rare or disease-driving cell states.
Chromium Single Cell technologies enable researchers to:
Identify rare or pathogenic cell populations
Characterise immune cell diversity and activation states
Study patient-to-patient variability at cellular resolution
Clinical impact:
Earlier identification of clinically relevant subpopulations improves hypothesis generation, patient stratification strategies, and biomarker discovery.
2. Linking molecular signals to tissue context
Understanding where cells are located within tissue is critical for clinical interpretation, particularly in oncology, immunology, and pathology-driven research.
Visium Spatial Gene Expression allows researchers to:
Map gene expression within intact tissue sections
Correlate molecular patterns with histology
Identify spatially distinct disease niches
Clinical impact:
Spatial context strengthens biological interpretation, supports translational relevance, and enables more compelling mechanistic narratives for grants and publications.
3. Translating discovery into spatial validation
Discovery technologies are most powerful when paired with targeted validation in clinically relevant samples.
Direct visualisation of clinically relevant gene signatures
Confirmation of biomarkers within preserved tissue architecture
Clinical impact:
Xenium supports the transition from discovery to validation which is a critical step for translational studies, diagnostic development, and clinical adoption.
4. Accelerating the path from pilot data to funding
Clinical research is often constrained by:
Limited sample availability
Ethical and governance considerations
The need to justify scale and cost upfront
10x Genomics platforms are well suited to small, high-information pilot studies, allowing researchers to:
De-risk experimental design
Generate convincing preliminary data
Strengthen ARC, NHMRC, and translational grant applications
Clinical impact:
High-quality pilot data reduces uncertainty and accelerates progression to larger, funded studies.
5. Enabling multi-modal clinical insights
Complex clinical questions rarely have single-dimensional answers.
10x Genomics workflows support:
Integration of transcriptomics, immune profiling, and spatial biology
Cross-platform studies linking cell state, location, and function
More comprehensive biological models of disease
Clinical impact:
Multi-modal data improves robustness, reproducibility, and translational relevance which is increasingly expected by reviewers and collaborators.
6. Supporting reproducibility and scalability in clinical settings
Clinical research demands consistency, robustness, and scalability.
10x Genomics technologies are:
Highly standardised and widely adopted
Supported by validated workflows and protocols
Designed for reproducible data generation across sites
Clinical impact:
Standardisation supports multi-centre studies and facilitates collaboration between hospitals, academia, and industry.
Apply for the Clinician Researcher Accelerator Program now!
One winner will be awarded 50% discount across Xenium v1 or 5k Prime panel*(2 slides) and Xenium running consumables Or One Flex kit (16-sample configuration)
All approved applicants will receive a 25% discount
Orders must be placed by 19 June 2026
*Custom panels excluded.
Application timeline
• Applications close: 27 May 2026
• Outcome notification: 1 June 2026
Fill in the form below to submit your application now!
Graduate students and early to mid-career researchers with no prior hands-on experience using 10x Genomics technologies are invited to apply for the prestigious 2026 Millennium Science – 10x Genomics Fellowship Program.
This Fellowship is designed to support researchers who are keen to adopt cutting-edge single-cell and spatial technologies in their work.
Important Dates
Applications close: 16 March 2026
Outcomes announced: 30 March 2026
Fellowship Focus: FFPE Samples
The 2026 Fellowship Program focuses on the application of 10x Genomics technologies to FFPE samples, using one or more of the following platforms: Chromium Single Cell Visium Spatial Xenium In Situ (NEW within the Fellowship Program!)
Fellowship Benefits
Successful applicants will receive:
A personalised mentoring session on experimental design with a 10x Genomics specialist
Dedicated support from the Fellowship Program Coordinator
10x Chromium or Visium CytAssist demo instrument placement (if required and subject to availability)
Support with project onboarding through a core facility running 10x Genomics platforms (Chromium, Visium or Xenium)
Discounted 10x Genomics consumables*
Invitation to present at Millennium Science–10x Genomics events
Membership in the Millennium Science–10x Genomics Fellows Network
Fellowship-exclusive merchandise
A certificate confirming completion of the Fellowship Program
Applications will be assessed by a panel of scientific experts from Millennium Science and 10x Genomics, based on project innovation, feasibility, and potential to inspire future research.
Through this program, Millennium Science and 10x Genomics aim to empower early and mid-career researchers to generate high-quality pilot data using advanced multi-omics technologies, supporting future experimental design and funding applications. *Please note, the Fellowship is not associated with provision of free reagents. Discounts cannot be combined with other promotions.
Application Details
To apply, please submit:
Project title: 20 words maximum
Abstract: 250 words maximum
CV: Attach 1-page CV
Letter of Support: Please provide a letter of support from the principal investigator of the laboratory. Additional institutional or departmental letters of reference may be submitted to support the application.
Completion of the online application survey below is required to submit your application.
Applications will be reviewed by Millennium Science as they are being received. Successful applicants will be notified via email.
Conditions of Eligibility
No previous personal experience using 10x Genomics technologies
Open to graduate students and early to mid-career researchers (up to 15 years post-PhD; special circumstances may be considered with supporting documentation)
Selected candidates must complete the specified individualised training program prior to reagent delivery or instrument placement
Applicants must be based in Australia or New Zealand
Hear from Our 10x Genomics Fellowship Alumni
“I was fortunate to receive the Millennium Science-10x Genomics Fellowship in 2021 during my first postdoctoral appointment in Associate Professor Megan Wilson’s lab at the Department of Anatomy, University of Otago, where her lab studies whole-body regeneration in the marine tunicate Botrylloides diegensis. At a time when single-cell technologies were still emerging, the Fellowship enabled us to rapidly adopt 10x Genomic technology and interrogate this process at unprecedented resolution. After some optimisation, our first 10x run produced a high-quality dataset that underpinned a recent publication in Development. Importantly, the Fellowship established long-term single-cell capability in the lab, directly benefiting lab member Berivan Temiz, who applied this method extensively during her PhD. I continue to find 10x Genomics the most user-friendly and straightforward to implement.” Michael Meier
“I moved to Melbourne in 2015 from Phuket, Thailand to pursue my passion for biomedical science. I completed my PhD at Monash University in 2023,investigating how epigenetic mechanisms shape B-cell biology, particularly the role of the histone methyltransferase DOT1L in regulating immune cell identity and function. My research is driven by a desire to understand how immune cells adapt in different disease contexts and how gene regulation disruptions contribute to chronic inflammatory conditions. In early 2023, I was honoured to receive the Millennium Science-10x Genomics Fellowship, which has been pivotal in advancing this work. With their support, I implemented single-cell multiome sequencing to profile circulating B cells from individuals with chronic disease, including Long COVID-a debilitating, multi-system syndrome that remains poorly understood. By measuring gene expression and chromatin accessibility in the same cell, this approach reveals subtle immune signatures and hidden cellular states, opening new avenues for diagnosis and treatment. The Fellowship provided not only advanced technology, but also personalised mentorship, technical guidance, and connection to a collaborative network of fellows across Australia and New Zealand. This support has accelerated my research and positioned me to tackle ambitious questions about immune dysfunction in complex diseases like Long COVID.” Liam Kealy
Bridging Flow Cytometry with Single-Cell Sequencing
Flow cytometry has long been the backbone of high-dimensional single-cell analysis. With the ability to measure up to ~45 parameters per cell, flow has enabled researchers and core facilities to rapidly phenotype complex populations and enrich rare cell types with confidence.
But what if you could go further — without disrupting your existing workflows?
By integrating flow cytometry with single-cell sequencing, researchers can now move beyond predefined panels and surface markers to uncover deeper, unbiased biological insight.
Why Bridge Flow Cytometry with Single-Cell Sequencing?
Flow cytometry has long been the gold standard for measuring what you expect to see. But what about the biology you don’t expect? What about the rare cell states, subtle activation programs, and novel biomarkers that surface markers alone simply can’t capture?
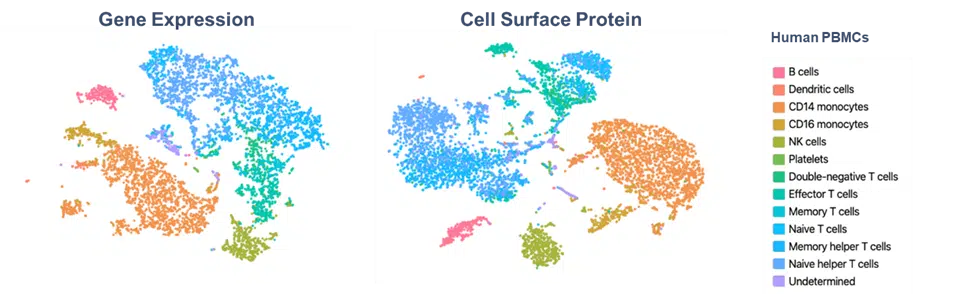
This is where single-cell sequencing transforms your capabilities. By bridging flow cytometry with the 10x Genomics platform, you can move from measuring dozens of parameters to profiling 300+ protein markers—with the option to simultaneously capture whole-transcriptome gene expression from the same single cell.
Unmatched multiplexing without compromise Breaking free from spectral overlap limitations opens new possibilities. Instead of carefully balancing fluorophore combinations, you can now interrogate hundreds of protein markers alongside comprehensive gene expression data. This quantum leap in multiplexing reveals cellular complexity that traditional flow simply cannot access.
Discovering What’s Hidden Many critical cell states appear identical by surface protein analysis alone. Activation, exhaustion, differentiation, and stress states often require deeper molecular investigation to truly distinguish. Single-cell sequencing uncovers these hidden layers of heterogeneity, revealing novel populations and functional states that would otherwise remain invisible.
Deeper biology from enriched populations Leverage FACS to isolate rare or complex populations, then apply single-cell sequencing to achieve transcriptome-wide and high-plex proteomic resolution.In short: sort with flow, then profile with depth.
Designed for Your Workflow
The beauty of this approach is that it builds on what you already do exceptionally well. Use FACS to enrich the rare or complex populations you’re interested in, then apply single-cell sequencing to achieve transcriptome-wide resolution. Your expertise in flow cytometry becomes the foundation for even more powerful discoveries.
What Can You Unlock?
By pairing flow cytometry with single-cell sequencing, researchers can access a new layer of biological resolution:
Unbiased cell type and state discovery Identify known and novel populations without relying on predefined antibody panels.
Protein validation with gene expression Confirm antibody signals and distinguish protein presence from true pathway activation.
Functional state resolution beyond surface markers Dissect activation, exhaustion, differentiation and stress states that appear identical by flow.
Pathway-level biology at scale Interrogate canonical pathways such as Wnt, TCR and interferon signalling through coordinated gene expression, rather than single proxy markers.
High-plex protein analysis at a significantly reduced cost
Support for more projects, more users and more samples
No requirement for RNA profiling, where transcriptomics isn’t needed
For many flow cores, this opens the door to offering advanced single-cell services without the overhead of full transcriptome assays.
The Natural Next Step for Flow Cytometry
The integration of 10x Genomics technology with your existing flow cytometry services doesn’t mean disrupting established workflows—it means enhancing them. Your team’s expertise in high-dimensional single-cell analysis positions you perfectly to take this next step.
As the authorised 10x Genomics distributor in Australia and New Zealand, Millennium Science is here to help you understand how single-cell sequencing can complement and extend your current offerings. Whether you’re looking to add new capabilities, support cutting-edge research, or simply explore what’s possible beyond traditional flow, our specialists are ready to guide you through the options.
Ready to expand your core’s capabilities?
Contact our team today to learn more about 10x Genomics solutions and how they can seamlessly integrate into your core facility workflows.
To help us meet your delivery requirements before the Christmas break, please note the following important dates:
For general consumable items: Place your order by 12 PM, Wednesday 26 November 2025.
For 10x Genomics consumables: Place your order by 4 PM, Monday 1 December 2025.
Instrument delivery times will be provided on a case-by-case basis.
Orders received after these dates are welcome, however delivery will likely take place in early 2026 due to expected closure of institute receiving facilities.
Holiday Schedule
Our office will close at 12 PM on Tuesday 23 December 2025 and reopen on Friday 2 January 2026.
No orders will be processed during the office closure.
The Millennium Science warehouse’s final shipping day will be Wednesday 17 December 2025, resuming dispatches on Monday 5 January 2026.
Thank you for your continued support throughout 2025. We wish you a safe and joyful holiday season!
Please note: These dates are subject to product availability and the delivery facilities at your institution being operational.
Endotoxins – lipopolysaccharides derived from Gram-negative bacteria – can trigger immune responses that compromise experimental accuracy, particularly in cell-based and in vivo studies. Sino Biological’s ProPure™ Endotoxin-Free Recombinant Proteins are produced under animal-free conditions using a proprietary purification workflow that delivers exceptionally low endotoxin levels (<0.1 EU/μg). Designed to meet the stringent demands of immunology, inflammation, and preclinical research, ProPure proteins provide confidence in experimental results by reducing background immune activation and ensuring reproducible data.
Why Endotoxin Contamination Matters
Endotoxin contamination is a hidden but significant variable in biological research. Even trace amounts can lead to false-positive immune responses in assays or alter cytokine production in cell models. Traditional recombinant protein expression systems, particularly those using E. coli, often yield proteins contaminated with endotoxin residues, making additional purification essential before sensitive applications.
Introducing Sino Biological’s ProPure™ Solution
Sino Biological’s ProPure™ line was developed to address this critical challenge. Through an advanced combination of expression system optimisation, multi-step purification, and endotoxin removal, ProPure proteins achieve endotoxin levels below 0.1 EU/μg—surpassing industry standards. This makes them particularly well-suited for applications such as:
In vivo animal studies requiring endotoxin-free reagents
Cell stimulation and activation assays where innate immune pathways are measured
CAR-T, vaccine, and antibody development research
Inflammation and immunology studies sensitive to TLR activation
Animal-Free Production and Reliable Activity
All ProPure proteins are animal-free, removing variability associated with serum-derived materials. The streamlined production process also retains native protein conformation and biological activity – critical for achieving consistent results across experiments.
Compared to standard recombinant proteins, ProPure reagents minimise background cytokine induction and non-specific immune activation, helping researchers distinguish true biological responses from endotoxin artefacts. By ensuring reproducibility and reliability, these proteins support high-quality data generation in translational and preclinical research environments.
Supporting Reproducibility and Regulatory Confidence
With growing emphasis on data integrity and regulatory compliance, ProPure™ Endotoxin-Free Proteins represent a valuable upgrade for any lab working with immune cells, organoids, or animal models. Their consistent low-endotoxin profile helps meet the rigorous standards required for translational and preclinical workflows.
Conclusion
When precision matters, ProPure™ Endotoxin-Free Recombinant Proteins provide unmatched purity and performance. By eliminating one of the most common sources of experimental variability, researchers can trust that their immune-related findings reflect biology – not contamination.
Unless a formal Supply Agreement exists, a valid Purchase Order accepted by Millennium Science forms a binding commercial agreement.
A valid Purchase Order should:
• Be issued by an authorised representative.
• Include the Purchase Order number.
• Reference the Quotation number and quoted prices.
• Clearly identify the goods or services being purchased.
• Include delivery and invoicing addresses.
A Purchase Order is deemed accepted only when Millennium Science issues an Order Confirmation, commences performance, or dispatches the goods.
Once accepted, Purchase Orders cannot be cancelled unless both parties agree in writing. Millennium Science reserves the right to accept or decline any Purchase Order. Where a formal Supply Agreement exists, that agreement takes precedence over these Terms where any inconsistency exists.
2. Pricing
Prices are based on supplier pricing, freight charges, customs duties and exchange rates applicable on the quotation date. Millennium Science may adjust prices before shipment if these costs materially change.
3. Shipment and Delivery
Delivery times are estimates only and may vary depending on manufacturer production schedules, product availability, importation requirements and freight availability. Millennium Science shall not be liable for any indirect or consequential loss arising from delayed delivery.
Where a delivery date has been agreed, Millennium Science will make reasonable efforts to meet that date. Delivery dates are estimates only and are not guaranteed.
Millennium Science is not liable for delays caused by events outside its reasonable control, including supplier delays, freight delays, customs or weather events. Customers may not refuse delivery solely because of a delivery delay unless otherwise agreed in writing.
Unless otherwise agreed, Millennium Science may select the most appropriate freight carrier. Freight charges will be itemised where applicable.
Millennium Science will notify the Customer of the following at the time of dispatch:
• Courier Company
• Shipping Date
• Consignment Number
Transfer of risk and control
Risk in the goods, and control of the goods for the purposes of supply, passes to the Customer when the goods are delivered to the delivery address specified in the relevant Purchase Order, as evidenced by the carrier’s proof of delivery or other delivery confirmation.
Millennium Science remains responsible for the goods until delivery, except where loss or damage arises from the Customer’s instructions, failure to accept delivery, or failure to provide a suitable delivery location.
The Customer must inspect the goods promptly on delivery and notify Millennium Science of any shortages, incorrect items or visible damage as soon as reasonably practicable.
Inspection on Delivery
Upon receipt of the goods, the Customer must inspect the shipment against the delivery note and notify Millennium Science Customer Service as soon as reasonably practicable of any shortages, incorrect items, or visible damage. Claims relating to damage should be supported by clear photographs of the affected goods and packaging where possible. Failure to notify Millennium Science within a reasonable time may affect our ability to investigate the claim with the freight carrier or manufacturer.
Storage of Products
Product storage requirements may vary depending on the manufacturer and product type. The Customer is responsible for ensuring products are stored under the recommended conditions immediately upon receipt. Please refer to the applicable manufacturer’s product datasheet, packaging, or instructions for detailed storage and handling requirements. Millennium Science is not responsible for product deterioration resulting from improper storage after delivery.
4. Payment Terms
Invoices will clearly identify the relevant Purchase Order and goods or services supplied.
By providing a Purchase Order the Customer agrees to pay the invoice value in full within 14 days of the issued invoice date (typically the same date a shipment occurs) or as otherwise agreed in the Quotation. Invoicing may occur at dispatch; however, where delivery occurs after the invoice date, revenue will be recognised in accordance with the delivery terms above.
Failure to pay on time may result in a 1% late payment fee. Site specific, inter-department or third-party delays will not be accepted as legitimate reasons for delayed payments.
Quoted prices remain valid only for the validity period stated in the Quotation.
For purchases exceeding $200,000, a 70% deposit is required upon placing the Purchase Order, unless otherwise agreed in writing.
5. Variation to Payment Terms
Millennium Science may vary payment terms where appropriate, including for special projects, custom products or milestone-based deliveries.
Any revised payment schedule will be detailed in the Quotation, Supply Agreement or other written agreement.
6. GST
Goods and Service Tax (GST) of 10% will be applied where required under Australian tax law. GST will not be charged on qualifying export sales, including exports to New Zealand.
7. Returns and Restocking
Millennium Science do not generally accept goods for return if they have been correctly supplied against a Purchase Order.
Under special circumstances certain equipment, spare parts and accessories ordered in error may be returned to our warehouse. The return would be at the expense of the Customer, the goods must not have been opened or used, and are not in your possession for longer than 14 days. A 25% restocking fee may apply.
Reagents, consumables, and temperature-controlled products cannot be returned unless they are defective or otherwise required by applicable law. Products supplied with a limited shelf life in accordance with the manufacturer’s specifications are not eligible for return solely due to their remaining shelf life.
10. Freight and Installation
Freight and installation charges will be itemised in the Quotation unless otherwise agreed in writing.
11. Commissioning
Where commissioning services are purchased, Millennium Science will provide qualified personnel to unpack, install, connect and test the equipment. Where applicable, an installation report will be provided.
12. Warranty
Millennium Science warrants that the products supplied are free from material defects in workmanship, subject to the applicable manufacturer’s warranty and any specific warranty terms stated in the Quotation.
The warranty does not cover misuse, accidental damage, unauthorised modification or repair, incorrect operation, failure to perform routine maintenance or consumable items such as batteries, lamps and fuses.
Except where prohibited by law, all other express or implied warranties, including warranties for merchantability or fitness for a particular purpose, are excluded.
13. Severability and Governing Law
If any provision of these Terms is found to be invalid or unenforceable, the remaining provisions will continue in effect.
These Terms are governed by the applicable laws of Victoria, Australia.
14. Limitation of Liability
Millennium Science reserves the right to adjust prices before shipment where supplier costs, exchange rates, freight charges, import duties or government charges materially change after the quotation date.
To the maximum extent permitted by law, Millennium Science’s liability shall be limited to repair, replacement or refund of the purchase price. Millennium Science shall not be liable for indirect, consequential, special or economic loss.
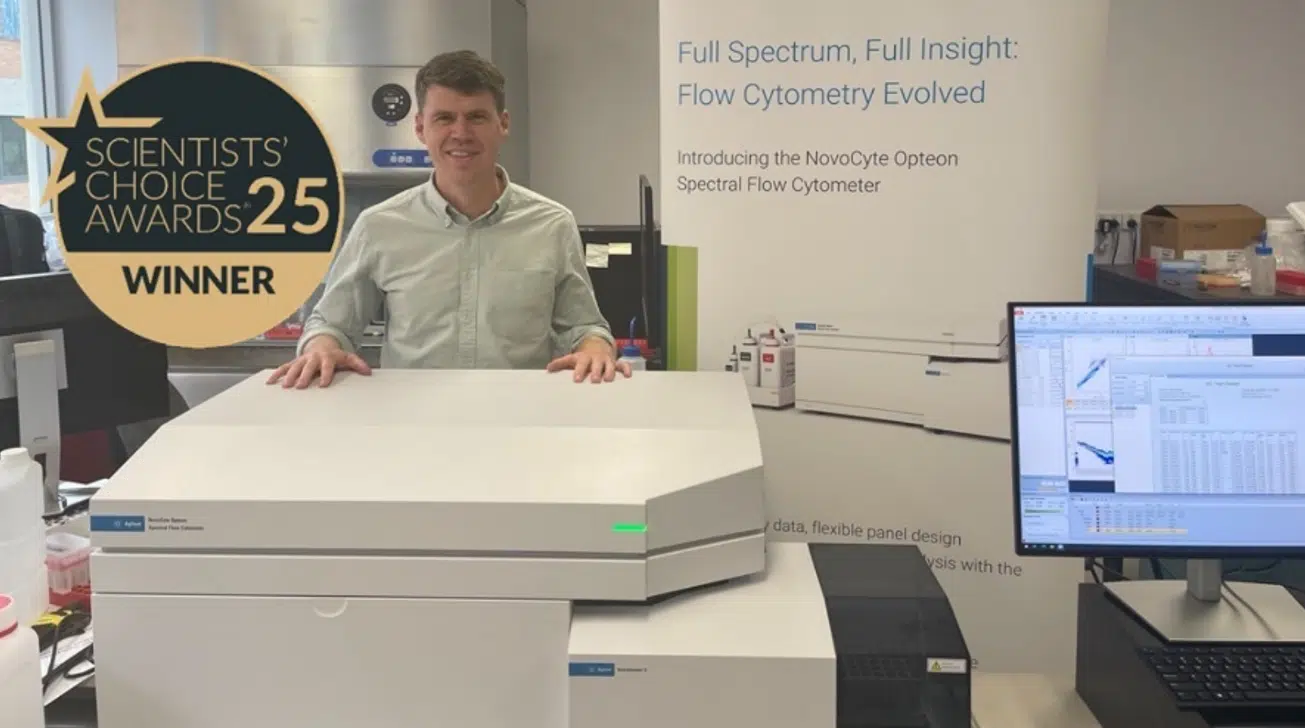
Spectral flow cytometry continues to transform single-cell research – and now, for the first time, laboratories in Australia and New Zealand can experience the Agilent NovoCyte Opteon first hand.
Launched globally at CYTO 2024, the NovoCyte Opteon has already earned international recognition, taking home the Select Science Scientist’s Choice Award for “Best New Drug Discovery & Development Product of 2024.” With up to five lasers, 73 detectors, and cutting-edge optical engineering, this system represents the next generation of high-dimensional cytometry – and it’s now available for demo in ANZ.
Spectral acquisition, redefined
Unlike conventional cytometry, the NovoCyte Opteon captures the full emission spectra of each fluorochrome across all lasers. This approach allows for greater panel flexibility, more accurate unmixing, and cleaner resolution of overlapping signals – ideal for complex immunophenotyping studies.
Spectral Flow Cytometry vs Conventional Flow: What’s the Difference?
Traditional flow cytometry detects fluorescence using individual optical filters for each fluorochrome, limiting panel size and often causing signal overlap. Spectral flow cytometry – like the Agilent NovoCyte Opteon – captures the entire emission spectrum from every fluorochrome across all lasers. This enables:
Greater panel flexibility with more markers in a single run
Improved accuracy through spectral unmixing of overlapping signals
Cleaner data by accounting for autofluorescence as a separate spectral component
The result is a more powerful, precise, and reproducible analysis – ideal for complex immunophenotyping and high-dimensional research.
Configurability and Optics
Researchers can choose 3-, 4-, or 5-laser configurations, with the flagship system spanning UV, Violet, Blue, Yellow/Green, and Red lasers – and up to 73 detectors. Agilent’s proprietary optics and electronics maximise sensitivity and spectral separation, ensuring high-quality data.
Dynamic Range, Small-Particle Detection, and Autofluorescence Handling
It boasts a wide dynamic range both for fluorescence and scatter (size) detection, reducing the need for frequent detector adjustments.
Dual-laser small particle detection (using 405 nm and 488 nm SSC) enables detection of particles down to ~80 nm without needing separate adjustments between cell and particle modes.
Also, the instrument supports autofluorescence subtraction (i.e. treating autofluorescence as a spectral component), which helps resolve dim populations more clearly.
Reliability and Stability Built In
To maintain performance in variable lab environments, the NovoCyte Opteon integrates on-board temperature control, fluidics monitoring, electronics sensor circuits, and real-time instrument status feedback.
Automation and Throughput
It’s compatible with the NovoSampler S, accepting 40-tube racks and microplates (384/96/48/24), and is ready for robotic automation. Calibration is automated, with templates for labware types saved for reproducibility. Carryover is minimal (< 0.1 %) via rinse cycles.
Software and Workflows
Agilent’s NovoExpress (Opteon) software version 2.0+ underpins the acquisition, unmixing, analysis, and reporting workflow. They’ve enhanced the user interface with an “unmixing” tab, streamlining spectral unmixing steps. The software supports both real-time acquisition and downstream “offline” analyses.
Joe’s Takeaway
The arrival of the Agilent NovoCyte Opteon in the ANZ region marks a real milestone for spectral flow cytometry. Local researchers now have access to one of the most advanced, award-winning platforms available – combining powerful optics, automation readiness, and Agilent’s renowned reliability, all supported locally by Millennium Science.
If you’re interested in demoing the award-winning NovoCyte Opteon Spectral Flow Cytometer, we’d love to hear from you. Reach out to arrange a hands-on session and see what spectral flow can really do for your research.
And if you’re attending CYTO-Connect (Perth, November 27-29, 2025), come and say hello – we’ll be there showcasing the Opteon and chatting all things spectral!
Spatial biology is transforming the way we understand biological systems. By integrating spatial information into research, it provides a holistic view of how cells and molecules interact within their native environment. This approach sheds light on the complex interplay between cellular and molecular components, offering deeper insights into the function and behaviour of living organisms.
To achieve reliable and reproducible results in spatial biology, careful antibody selection is essential. Here are some key considerations:
Consider Host and Target Species
Secondary antibody selection begins with species. The host of your secondary must differ from both the tissue species and the host of the primary antibody. For example, when using a rabbit primary antibody on human tissue, a goat anti-rabbit secondary is preferred. This reduces background interference and ensures the signal reflects true binding rather than cross-reactivity..
Match Secondary to Primary Class
Not all primary antibodies are the same. Polyclonal IgGs require anti-IgG secondaries, while monoclonal IgMs need anti-IgM secondaries. For monoclonal IgG subclasses (such as IgG1), it is best practice to use subclass-specific secondaries (anti-IgG1) for maximum accuracy. This level of matching safeguards against nonspecific binding and strengthens reproducibility.
Affinity-Purified: Cut the Noise
Affinity purification ensures secondaries recognise their targets with high specificity. By removing unwanted immunoglobulins, affinity-purified antibodies deliver clearer signals and consistent results – especially when detecting low-abundance proteins. The result: less noise, less background, and greater confidence in your data.
Cross-Adsorbed for Multiplexing
Spatial biology thrives on multiplexing, but multiple species and fluorophores introduce complexity. Cross-adsorbed antibodies are refined to remove cross-reactive components, lowering background and minimising false positives. This makes them ideal for multi-label experiments where precision is paramount.
Choose the Right Fluorophores
Signal clarity depends on the brightness and stability of your fluorophores. Rockland offers a wide range of conjugates, including DyLight™, Cy™, and FITC dyes. These high-performance labels are particularly powerful for detecting low-expression targets, ensuring that no signal is missed in complex tissue environments.
A Case in Point: Neural Crest Imaging
In one example, Rockland’s DyLight™ 649-conjugated goat anti-rat secondary antibodies were used to visualise neural crest-derived cells infiltrating the brain region of a mouse embryo. The result was a sharp, specific signal that allowed researchers to trace cell migration and interactions in detail. This illustrates the impact that well-chosen secondary antibodies can have on spatial imaging outcomes.
Figure: Neural crest-derived cells in a P0-Cre/EGFP mouse embryo visualised with Rat IgG (H&L) DyLight™ 649-conjugated pre-adsorbed goat polyclonal secondary antibody.
Conclusion
When it comes to spatial biology, success is in the details. Rockland’s secondary antibodies – affinity-purified, cross-adsorbed, and conjugated to high-performance fluorophores – provide the specificity and sensitivity needed for reproducible results.
Cells don’t stand still, so why should your assays? The Agilent xCELLigence RTCA eSight™ goes beyond snapshots, revealing real-time cell behaviour with label-free impedance and live imaging.
By pairing biosensor impedance technology with live-cell imaging, eSight enables researchers to monitor cell health, function, and behaviour simultaneously, continuously, and in real time. It’s not just more data, it’s deeper, more meaningful insight into what your cells are really doing.
How Real Time Cell Analysis (RTCA) Technology Works
At the heart of RTCA eSight are proprietary E-Plates, embedded with gold biosensors. These electrodes non-invasively measure impedance, which reflects cell metrics such as:
Proliferation
Adhesion strength
Morphological changes
Migration and differentiation
Because impedance is recorded continuously, you capture events as they happen, in seconds, minutes, hours, or days, without disturbing the cells. The temporal resolution is exquisite, allowing you to see subtle shifts long before they’re visible under a microscope.
In concert with impedance, eSight’s imaging module provides brightfield plus three fluorescence channels (red, green, blue). This lets you visualise your cells directly while validating and enriching the kinetic impedance data.
The result is a spatial and temporal view of cell populations at an unprecedented level of detail, ideal for assays like proliferation, cytotoxicity, and apoptosis. And importantly, impedance and imaging are performed on the same cells, not replicate wells, so your data are directly correlated.
Left: Live-cell imaging of apoptosis markers with Agilent xCELLigence RTCA eSight, showing Annexin V, Caspase 3, and nuclear BFP fluorescence with matching reagents. Right: Live-cell imaging of apoptosis markers with Agilent xCELLigence RTCA eSight, showing Annexin V, Caspase 3, and nuclear BFP fluorescence with matching reagents.
Streamlined RTCA Workflow
One setup, two data streams. Here’s how simple it is:
Seed your cells into an E-Plate.
Insert the plate into eSight (inside your incubator).
Define your assay in the RTCA software.
From there, impedance and imaging data are captured automatically, then integrated into a single timeline for straightforward analysis. The software even supports outputs like:
RTCA images
KT50 (time to 50% cytolysis at a given effector-to-target ratio)
% Cytolysis dose response curves
IC50 calculations
No juggling between platforms – just a unified dataset ready for export.
Applications Across the Board
Researchers are already applying RTCA eSight to:
Immune-cell killing assays – track cytolysis in real time with kinetic precision.
Virology – Screening and characterizing antiviral drugs in real time
Proliferation and apoptosis studies – capture early events, validate with imaging, and overlay with fluorescent markers.
Cell heterogeneity analysis – reveal subpopulation responses that would be lost in averaged data.
Joe’s Takeaway
The Agilent xCELLigence RTCA eSight is more than the sum of its parts. By integrating patented biosensor impedance with live-cell imaging, it delivers:
Continuous, label-free monitoring of cell health and function
Brightfield and Three-colour live-cell imaging for direct visual validation
Unified kinetic datasets from the same cell population
Broad versatility across immuno-oncology, virology, and general cell biology
For researchers who want to move beyond static snapshots, eSight offers a powerful new way to see biology unfold in real time, with the reproducibility, temporal resolution, and ease-of-use that modern labs demand.
LICORbio’s new Atlas™ Imager is redefining cell imaging for life science researchers across Australia and New Zealand. Built for both 2D and 3D assays, Atlas combines speed, scale, and clarity in a single, easy-to-use platform – empowering scientists to accelerate discoveries in drug development, translational research, and beyond.
Smarter, Faster, Scalable Imaging
Unlike traditional systems that require manual stitching or time-consuming illumination corrections, Atlas is engineered to deliver whole-plate imaging in less than one minute. Its patented line-scanning optical system minimises background fluorescence, boosts sensitivity, and enhances multiplexing capabilities – critical for high-throughput screening and complex cell-based assays.
Key advantages of the LICORbio Atlas
High throughput – Acquire entire well plates rapidly or zoom into single wells with up to 5µm resolution.
Broad applications – Capture cell viability, luminescence, and multiplex fluorescence data in one instrument.
Deep 3D imaging – Confidently image spheroids, organoids, organ-on-a-chip models, and other microphysiological systems.
Ease of use – Streamlined workflows reduce manual steps and consolidate multiple instruments into one solution.
Cost-effective – Higher-content imaging without the high price tag of competitive systems.
From monitoring cell culture to high-resolution plate and well scanning, Atlas provides reliable, reproducible, and quantitative results with minimal hands-on time. With over 30 imaging channels spanning UV to near-infrared, researchers gain unmatched flexibility for diverse applications – from drug screening to advanced tissue modelling.
By eliminating inefficiencies and post-processing steps, Atlas lets you focus on what matters most: generating insights that move science forward.
Why Atlas Stands Out
Whole-plate scans in under one minute
Z-stack multiplex fluorescence for 3D studies
Built-in luminescent imager
Over 30 imaging channels with six lasers plus RGB LED
End-to-end solution for cell-based assays
Accelerate Your Next Discovery
Whether you’re developing new therapeutics, studying disease models, or advancing organoid research, Atlas is the balanced solution for speed, sensitivity, and scalability in cell imaging.
A microarray is an assay that allows the simultaneous detection of multiple molecules – such as nucleic acids, peptides, proteins, or antibodies – within a small surface area. For example, thousands of molecules can be analysed on a standard glass slide (75 mm × 25 mm). Microarrays provide researchers and clinicians with a broad snapshot of biological processes at a given time.
One common type of microarray for protein analysis is the antibody array. Compared to traditional “single-plex” assays, such as ELISAs that analyse one protein at a time, antibody arrays are more cost-effective, require minimal sample volume, and enable multiplex protein detection. This blog explores the different antibody array formats, how they work, and considerations for choosing the right format for your research.
Capture antibodies are immobilised on solid substrates such as glass slides, membranes, or microbeads.
Planar surface arrays: Capture antibodies with known specificities are spotted on a slide or nitrocellulose membrane in an addressable format.
Bead-based arrays: Capture antibodies are bound to beads of varying sizes and fluorescent properties. Each bead’s characteristics indicate the target protein.
Step 2: Block the Array
Before sample incubation, the array is blocked to prevent non-specific binding. Protein-based blockers such as BSA or non-fat milk, often with a detergent (e.g., 1% Tween-20), reduce background noise and improve data accuracy.
Step 3: Add Samples and Detection Antibodies
During incubation, capture antibodies bind their target proteins. Unbound proteins are removed via washing.
Label-based arrays: Proteins are pre-labelled with biotin before incubation.
Sandwich-based arrays: Biotinylated detection antibodies are added after sample incubation, creating a “sandwich” with the target protein.
Alternative approaches, such as using a biotinylated lectin to detect glycosylated proteins, can also be employed.
Step 4: Detect Proteins via Chemiluminescence or Fluorescence
A streptavidin molecule conjugated to a fluorophore or horseradish peroxidase (HRP) binds to biotin. Detection is then achieved using:
Chemiluminescence: HRP substrate produces light, measured via CCD camera, X-ray film, or gel documentation system.
Fluorescence: Fluorophores are detected with laser scanners for glass slides or flow cytometry for bead-based arrays.
Figure 1: Array substrates and signal detection. (A) To produce antibody arrays, capture antibodies are immobilised onto glass, membrane, or microbeads in an addressable format. Different colours denote different target proteins. (B) Multiplex protein detection using fluorescence or chemiluminescence. *Imaged sourced from our partners Raybiotech.Figure 2: A comparison of label-based and sandwich-based immunoassays. (A) A capture antibody binds to a biotinylated protein. (B) The target protein is sandwiched between a capture antibody and a biotinylated detection antibody. (C) The target glycan moiety on a protein is sandwiched between a capture antibody and a biotinylated lectin. *Image sourced from our partners Raybiotech.
Qualitative, Semi-Quantitative & Quantitative Data
Antibody arrays can generate:
Qualitative data: Visual inspection of signal intensity.
Semi-quantitative data: Fluorescent or chemiluminescent outputs with relative expression differences (fold changes).
Quantitative data: Data compared against a standard curve to determine exact protein concentrations.
Volume Requirements
Sample volume depends on the substrate, array design, and sample dilution:
Sample dilution: At least 2-fold to minimise “sample matrix effects” (SMEs) that can block antibody binding.
Protein concentration: For non-serum samples, aim for ≥1 mg/mL (ideally >2 mg/mL) for stronger signal.
Sample handling: Membrane-based arrays require more sample than glass or bead arrays but are easy to handle and have low background noise.
Difference between Label-based and Sandwich Antibody Arrays
Label-based Arrays
One antibody per protein (capture antibody).
High-density arrays possible (up to 6,000 human proteins).
Two antibodies per protein for higher specificity.
Available on membrane, bead, and glass substrates.
Provide semi-quantitative and quantitative data.
Ideal for clinical trials and biomarker validation.
A Comparison of Label-based and Sandwich-based Antibody Arrays
Decision tree to help choose the appropriate antibody array for the experiment.
* = Free scanning and data extraction for all glass-based arrays that require a compatible laser scanner provided by RayBiotech. Full testing services are also available, which include sample processing, scanning, data extraction, and data analysis.
Conclusion
Antibody arrays are a powerful tool for multiplex protein detection and profiling. High-density arrays are ideal for large-scale biomarker discovery, while smaller panels can focus on specific pathways such as inflammation, angiogenesis, or growth factors. Customisable panels and full testing services are available, making these arrays accessible even for laboratories with limited resources.
When it comes to multiplex protein analysis, researchers need accuracy, speed, and simplicity. Traditional flow-based systems have long been the standard, but they bring challenges: sheath fluids, blocked probes, and constant maintenance. Enter the Mabtech EYRA™ – a fluidics-free multiplex immunoassay platform that reimagines how scientists generate cytokine and biomarker data. With confocal imaging, RAWsphere analysis, and compatibility with EYRAplex bead kits, EYRA makes multiplexing faster, simpler, and more reliable.
Multiplex Without Compromise
With EYRAplex magnetic bead assays, EYRA can quantify more than 30 analytes from a single sample – whether that’s serum, plasma, or cell culture supernatant. This means less sample consumption, fewer runs, and richer datasets for every experiment.
At the core of EYRA’s precision is the RAWsphere image analysis algorithm. It identifies each bead, links it to the correct analyte, and quantifies the PE signal with high resolution. Whether you’re measuring six cytokines or a full 30+ panel, RAWsphere ensures your multiplex data is accurate and reproducible.
Watch video to see how EYRA works
Fluidics-Free Technology
EYRA is built around a completely flow-free design. No sheath fluid, priming, waste handling or blocked probes.
Instead of pushing samples through fluidics, EYRA uses confocal microscopy to image settled magnetic beads directly in the wells of a 96-well plate. Each bead carries a unique fluorescent dye signature for identification, while analyte-bound PE-labelled antibodies provide the quantitative signal.
The result? You insert your plate, select your assay in the intuitive Mabtech Opal™ software, and hit read. Fifteen minutes later, you have fully processed data – with your samples never leaving the wells.
From Plate to Excel - Fast
Opal™ software comes preloaded with templates for every EYRAplex kit. Standards, plate layouts, and gating are handled automatically – so you spend less time setting up and more time on results.
Once the plate read is complete, results are exported directly into Excel, with options for bulk export if you’re working on large studies or multiple plates. No manual reformatting. No data wrangling headaches.
The Maintenance-Free Mindset
Because EYRA is fluidics-free, there’s no daily calibration or cleaning. No flushing, no wasted consumables, and no time lost to instrument downtime. It’s genuinely a plug-and-play experience – switch it on, run your plate, and walk away with your data.
Joe’s Takeaway
The Mabtech EYRA isn’t just another multiplex platform – it’s multiplexing reimagined. By removing fluidics and harnessing high-resolution confocal imaging, EYRA delivers:
High-plex capacity: 30+ analytes per well
Fast turnaround: ~15 minutes per plate
No maintenance: no daily cleaning or calibration
Accurate, reproducible results: powered by RAWsphere analysis
For labs looking to streamline their workflow without sacrificing data quality, EYRA offers a fresh, frustration-free alternative to traditional flow-based systems.
Until next time… happy experimenting!
Joe Roberts, PhD
Product Manager
Millennium Science